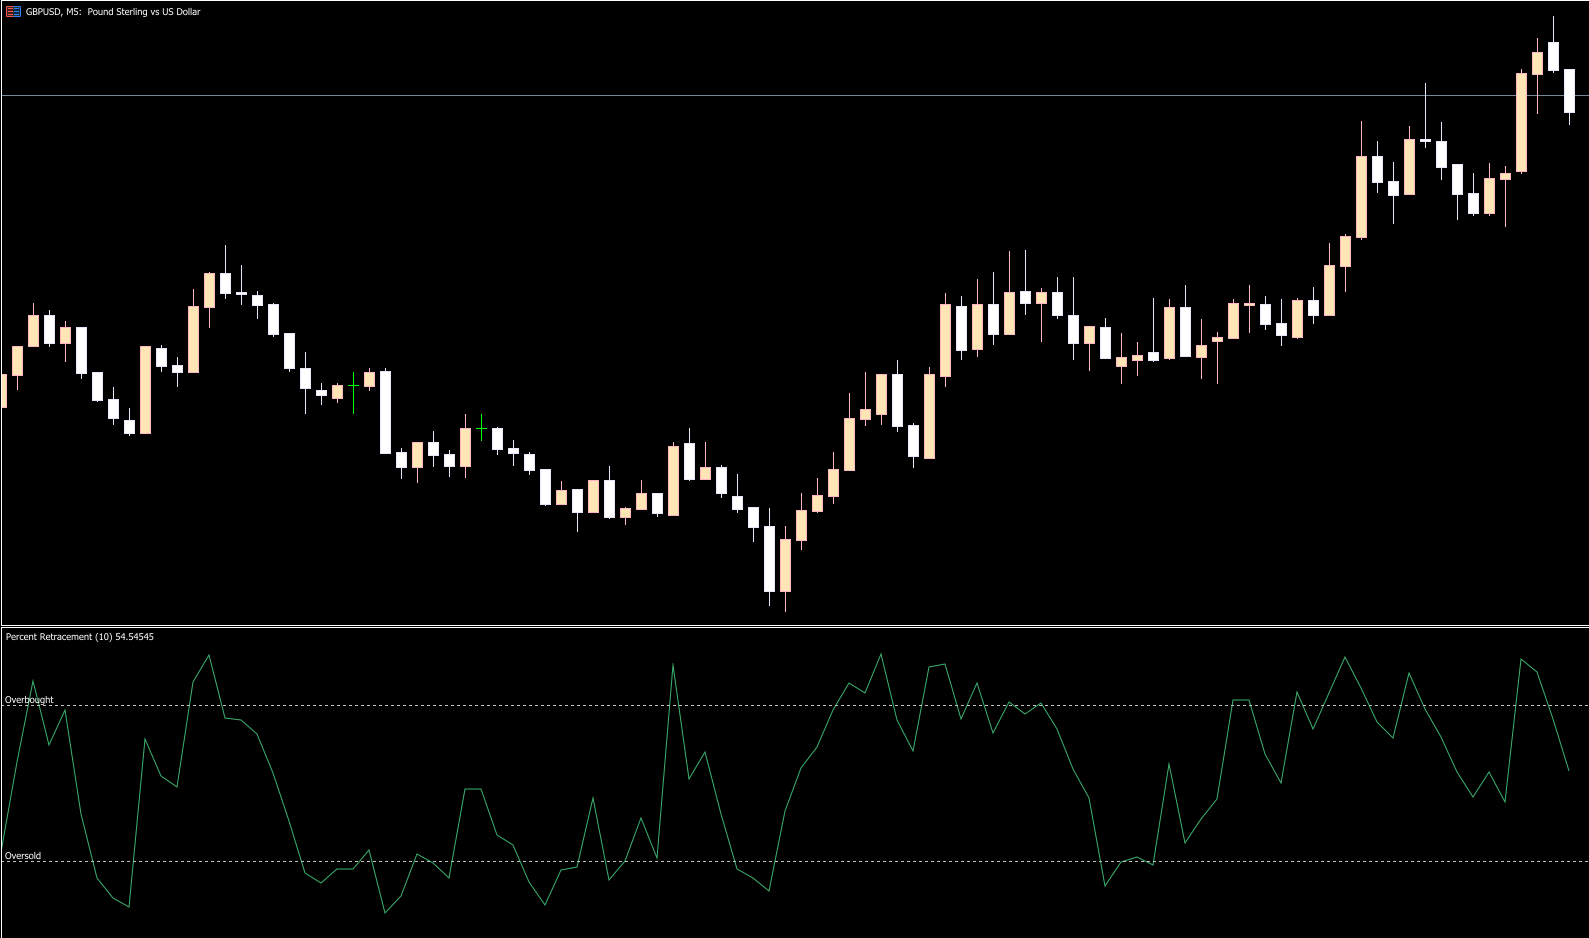
The Percentage Oscillator MT5 indicator displays the percentage change in price based on the previous period. Traders can customize the period length directly from the indicator settings, making it adaptable to different trading strategies.
Institutional traders—who trade large volumes—often make decisions around recovery levels and percentage-based price changes. They may add positions or protect existing ones at key percentage movement zones.
The Percentage Oscillator helps retail traders identify these same institutional price levels, providing insights into where significant market activity may occur.
Discover More
Algorithmic trading
MT5
MetaTrader 5
MT4
MetaTrader 4
Algo Trading
Trading psychology guides
Forex indicators bundle
Backtesting software
MetaTrader 5 indicators
Percentage Oscillator MT5 Indicator Trading Signals
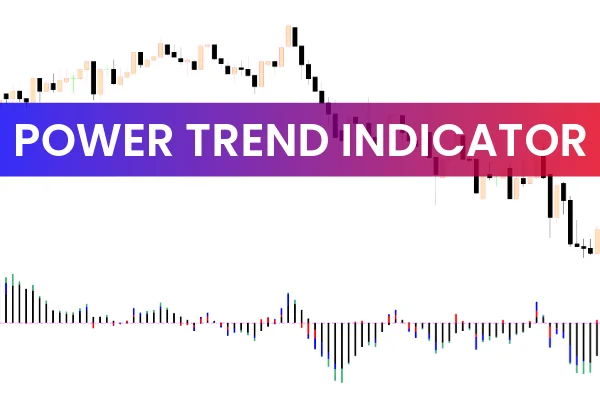
On the GBPUSD M30 chart example, the Percentage Oscillator is displayed as a green line moving between 0 and 100 in a separate window. The indicator also shows the current oscillator values in real time.
These institutional levels typically behave as support and resistance zones, meaning that price often responds at these percentage-based thresholds.
For best results:
Use these oscillator levels as part of your support-resistance analysis.
Look for reversals at extreme levels (overbought/oversold).
Maintain an “institutional trader mindset” when evaluating price reactions.
Because the indicator is designed to identify institutional levels, beginners should familiarize themselves with institutional trading methods for maximum benefit.
Conclusion
The MT5 Percentage Oscillator helps identify potential entry points based on institutional trading behavior. By revealing where major market participants may act, the indicator allows retail traders to enter positions at stronger and more informed price levels.
FAQ
1 Download
Published:
Dec 07, 2025 10:09 AM
Category: