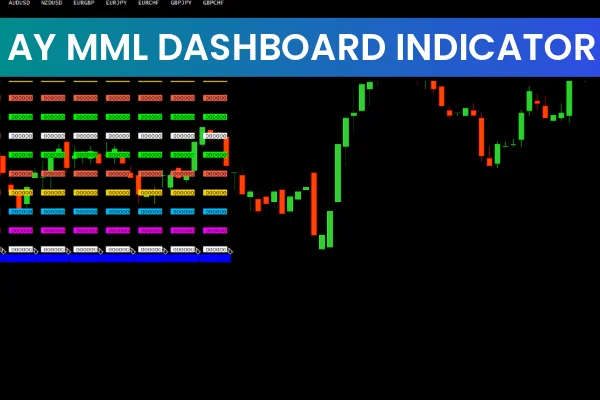
The AY MML Dashboard is a powerful Murrey Math Lines indicator designed to simplify technical analysis for modern traders. By displaying Murrey Math Support And Resistance levels across multiple timeframes and instruments, it provides a comprehensive overview of market conditions. Traders can easily identify price reversals, breakout zones, and key psychological levels—all from a single, organized dashboard.
At IndicatorForest.com, this cutting-edge tool is part of our growing library of professional-grade indicators that help traders make smarter, faster decisions.
What Makes the AY MML Dashboard Unique
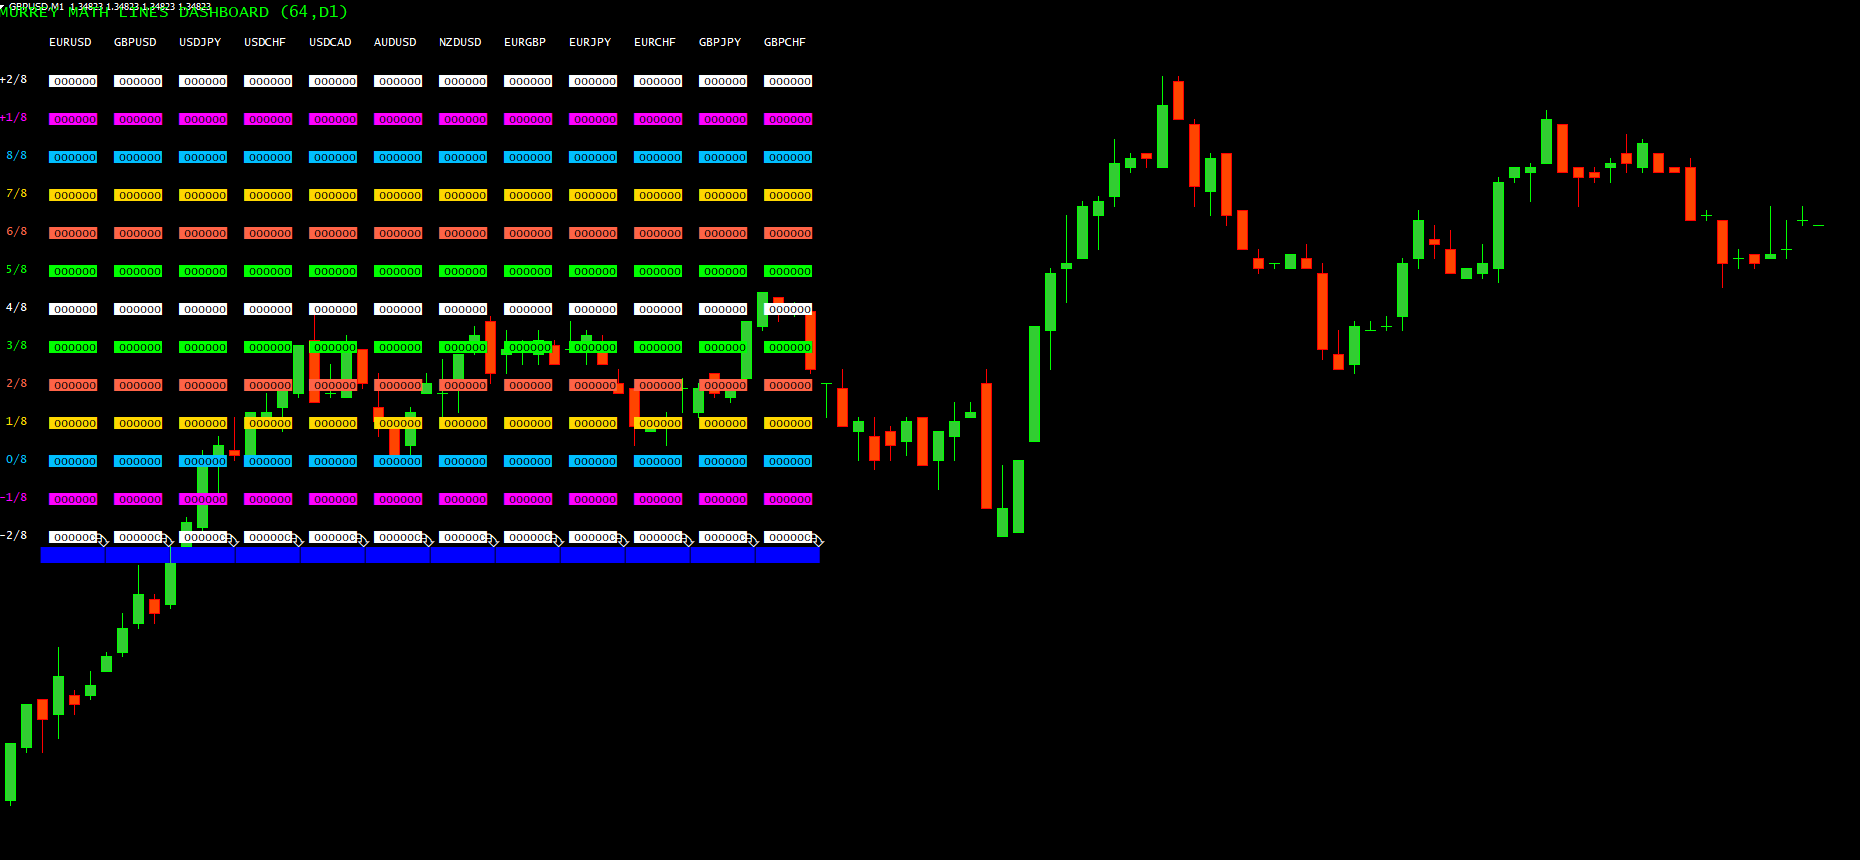
Unlike standard support and resistance tools, the AY MML Dashboard V1.1 leverages the precision of Murrey Math Lines (MML)—a method that divides the price chart into eight distinct octaves. Each octave highlights potential turning points in market behavior.
When the price approaches crucial MML levels like 8/8, 4/8, or -2/8, the dashboard visually alerts traders to possible trend reversals or breakouts. This helps both novice and experienced traders make data-driven decisions instead of relying on guesswork.
Multi-Symbol and Multi-Timeframe Efficiency
The AY MML Dashboard V1.1 was engineered with traders who monitor multiple instruments in mind. Whether you trade forex pairs, commodities, indices, or cryptocurrencies, the dashboard neatly organizes MML data across all your chosen symbols and timeframes.
Its compact mode ensures that critical information remains visible even on cluttered charts, while visual alerts draw attention to the most significant Murrey Math levels in real time.
This flexibility means you can adapt your strategy effortlessly—switching between short-term Scalping and long-term trend analysis without losing focus.
How Murrey Math Lines Enhance Trading Decisions
Murrey Math Lines represent a time-tested approach to mapping price movement psychology. By identifying equilibrium zones and overbought/oversold areas, traders gain a deeper understanding of market sentiment and momentum.
For example:
and -2/8 lines often mark extreme reversal points.
acts as a strong pivot or equilibrium level.
signals powerful support zones.
When integrated into the AY MML Dashboard , these principles become visual, actionable insights that help traders respond to changing market conditions with confidence.
Customization and User-Friendly Features
Every trader’s strategy is unique. The AY MML Dashboard allows complete customization of:
Symbols and instruments to monitor
Preferred timeframes (M15, H1, H4, etc.)
Display modes and alert preferences
These features make the indicator not only informative but also highly adaptable. Whether you’re a swing trader analyzing weekly trends or a day trader reacting to intraday volatility, this dashboard keeps you one step ahead.
Integrate AY MML Dashboard into Your Strategy
To maximize the benefits of the AY MML Dashboard , consider combining it with other reliable technical tools—such as moving averages, Fibonacci retracements, or Price Action signals. Together, they create a well-rounded framework for understanding Market Structure and improving trade timing.
For a deeper understanding of how to build your own systematic trading plan, explore our Trading
Course on IndicatorForest.com.
Conclusion – Simplify Analysis, Amplify Results
The AY MML Dashboard is more than just another technical indicator—it’s a complete trading assistant that merges clarity with efficiency. By visualizing Murrey Math Lines across multiple assets and timeframes, it empowers traders to identify high-probability setups quickly and confidently.
Visit IndicatorForest.com today to download the AY MML Dashboard V1.1 and transform the way you analyze the markets. Make smarter, faster, and more accurate trading decisions with the precision of Murrey Math.
FAQ
The AY MML Dashboard Indicator provides a comprehensive dashboard view of multiple market levels and trading signals. It displays key support and resistance levels, trend direction, and potential entry/exit points in a single visual interface, making it easier for traders to analyze market conditions at a glance.
The dashboard typically shows color-coded signals or levels that indicate market conditions. Green signals may indicate bullish conditions, red signals may suggest bearish conditions, and the dashboard displays key levels where price may react. This visual representation helps traders quickly assess market structure and make informed decisions.
Use the dashboard to identify key support and resistance levels, trend direction, and potential entry/exit points. The comprehensive view allows traders to see multiple market factors simultaneously, reducing the need to switch between different indicators. Combine with price action or other confirmation tools for better accuracy.
The dashboard format provides a comprehensive view of multiple market factors in a single interface, making analysis more efficient. It combines various technical elements into one visual display, helping traders save time and make faster decisions while maintaining accuracy in market analysis.
The indicator works on all MT4 timeframes and currency pairs, making it versatile for different trading styles. The dashboard format is particularly useful for traders who want a comprehensive market overview without cluttering their charts with multiple separate indicators.
1 Download
Published:
Dec 15, 2025 01:12 AM
Category: