Master Day Trading Ranges with the DJ Lines Indicator
In high-liquidity financial markets, trading blindly between daily sessions is an easy path to unnecessary drawdowns. Successful day traders and scalpers understand that Price Action does not move in a vacuum; it respects historical mathematical boundaries established by major institutional blocks. Identifying these intra-week ranges manually can lead to severe charting inconsistency. The DJ Lines indicator eliminates this complexity by automatically mapping macro support, resistance, and mathematical breakout levels right onto your active charts.
By tracking past session metrics, this essential tool presents an objective visual boundary system to streamline your daily execution loop.
Decoding the Structure of Automated Range Mapping
When monitoring intermediate intervals like the 30-minute ($M30$) chart, losing track of historical Market Structure is common. The DJ Lines indicator functions as an automated terminal utility, continually scanning key structural milestones from recent cycles.
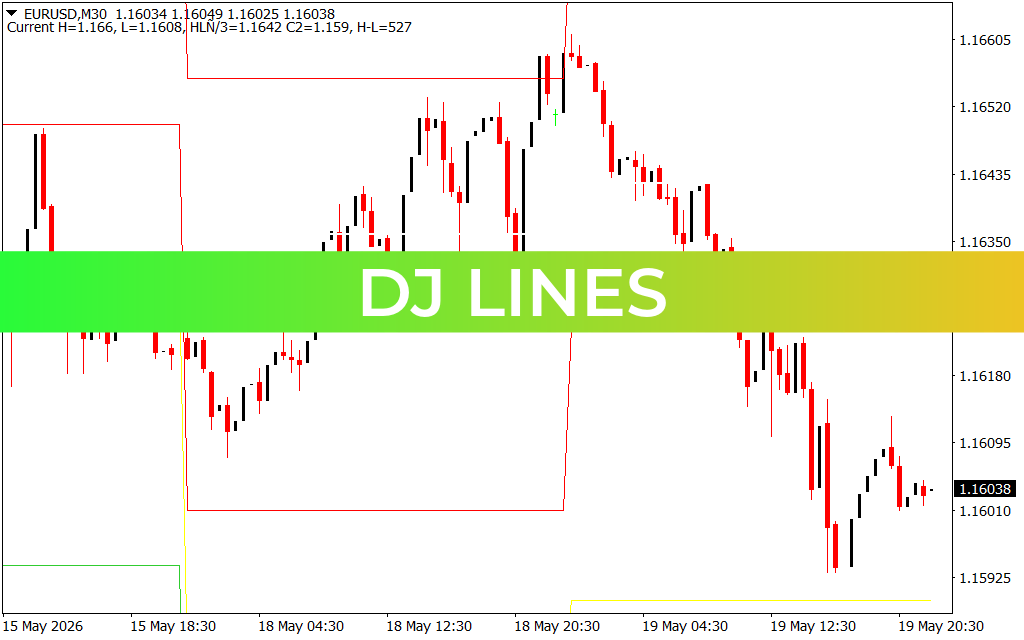
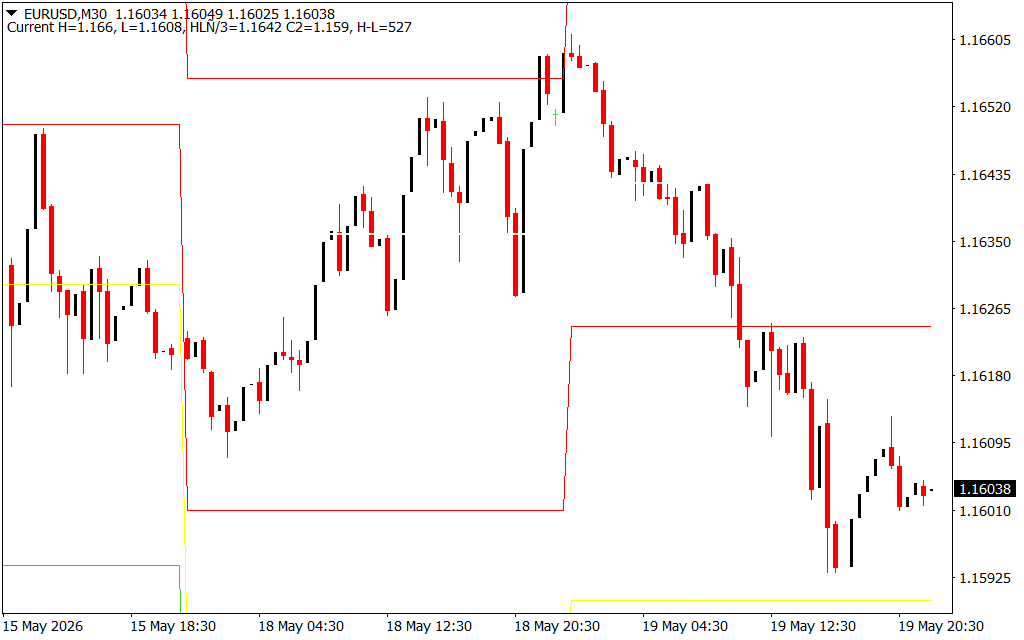
As displayed on the EUR/USD chart via the upper text string mapping current high and low variables (such as Current H=1.166, L=1.1608), the software draws distinct, step-like horizontal lines that represent vital psychological shifts:
- Institutional Supply Caps (Upper Red Lines): These levels indicate major historical price ceilings where selling volume previously stepped into the market. They mark critical distribution ranges where bullish momentum is highly likely to stall or reverse.
- Structural Floor Extensions (Lower Red/Yellow Lines): Positioned at the base of recent market cycles, these boundaries track institutional accumulation shelves. They provide instant visual confirmation of major buying zones where downside risk is historically minimized.
Executing Low-Risk Intraday Strategies with DJ Lines
Integrating the step-line dynamics of the DJ Lines tool into your MetaTrader setup establishes a highly mechanical framework for navigating volatile price swings.
1. Trading the Range Rejection (Mean Reversion)
During standard market conditions without high-impact news catalysts, price will naturally oscillate between the indicator's plotted boundaries. When an asset rallies into an upper DJ line boundary, stalls, and prints a bearish engulfing candle or an exhaustion wick, it provides a low-risk short entry target. Traders can target the opposing lower horizontal line as a clear mathematical take-profit objective.
2. Capitalizing on Breakout Extensions
When institutional volume drives the market outside of a long-standing DJ Lines boundary, it signals an explosive structural breakout. For instance, if an $M30$ candle closes decisively above an upper red resistance line, it confirms that market equilibrium has shifted entirely to the bulls. This breakout warning allows intraday traders to hunt for immediate continuation positions on pullbacks.
Conclusion
The DJ Lines indicator is a robust, clean chart management assistant designed to keep you aligned with structural institutional boundaries. By converting complex historical data into straightforward horizontal guide rails, it takes the guesswork out of daily range analysis. Download the DJ Lines indicator today to optimize your technical analysis setup and trade with objective precision.
1 Download
Last Update:
May 20, 2026 01:54 AM
Published:
Jan 19, 2026 11:21 AM
Category: