Isolating Market Cycles: The Band Pass Filter Indicator Explained
Financial data is inherently noisy, filled with unpredictable micro-spikes and erratic price movements that frequently lead to false technical signals. Traditional indicators, such as standard moving averages, attempt to solve this by smoothing the data, but this often introduces significant lag. For systematic traders looking to isolate pure market frequencies, the Band Pass Filter Indicator offers an advanced signal-processing solution. By filtering out both high-frequency noise and low-frequency trend lag, this technical tool isolates the dominant cyclical waves of an asset.
Here is an analysis of how this powerful indicator operates and how you can use its cyclical waves to time market turning points.
The Science of Band Pass Filtering
Borrowed from electrical engineering and digital signal processing, a band pass filter is an algorithm that allows signals within a specific frequency range (a passband) to pass through while attenuating (weakening) frequencies outside that range.
When applied to trading terminals, the indicator strips away two major problematic elements:
- High-Frequency Noise: The rapid, erratic price fluctuations that occur minute-by-minute and cause false breakouts.
- Low-Frequency Trends: The massive, long-term macroeconomic moves that create deep lag in traditional oscillators.
By isolating the middle frequencies, the Band Pass Filter uncovers the underlying rhythm or cycle of the market, turning messy price data into a smooth, predictive sine wave.
Interpreting the Cycles and Histogram Bars
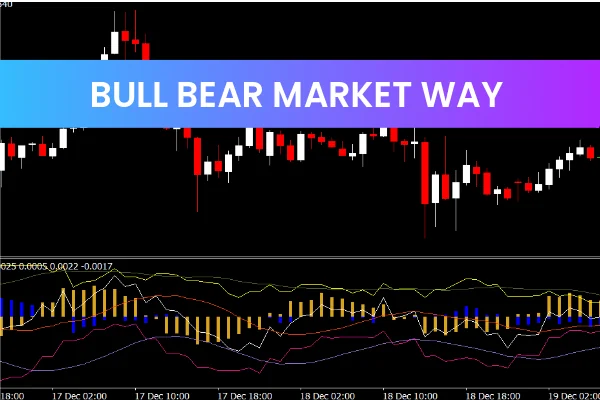
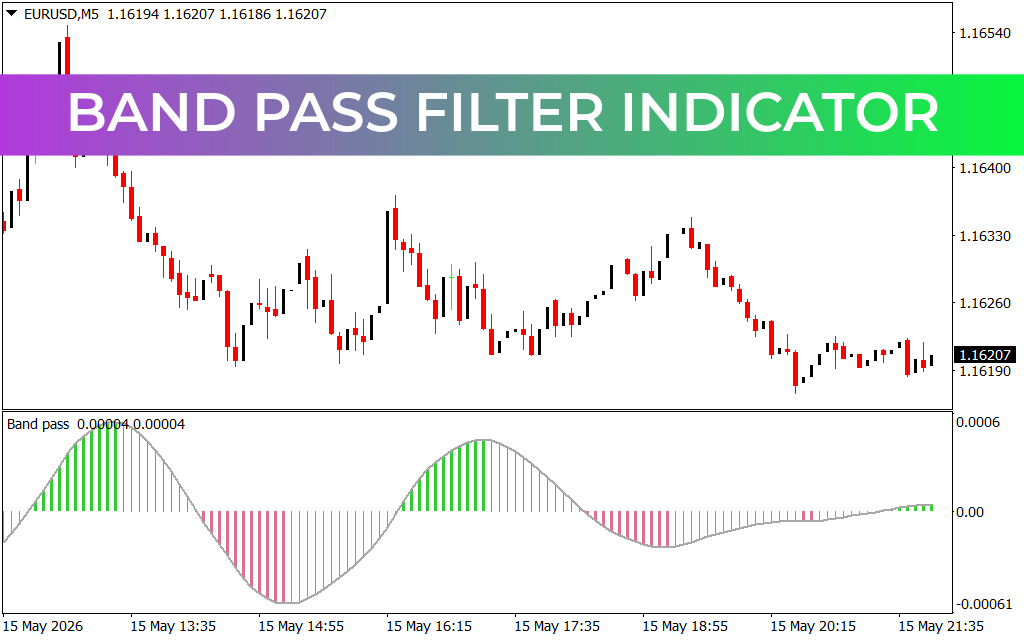
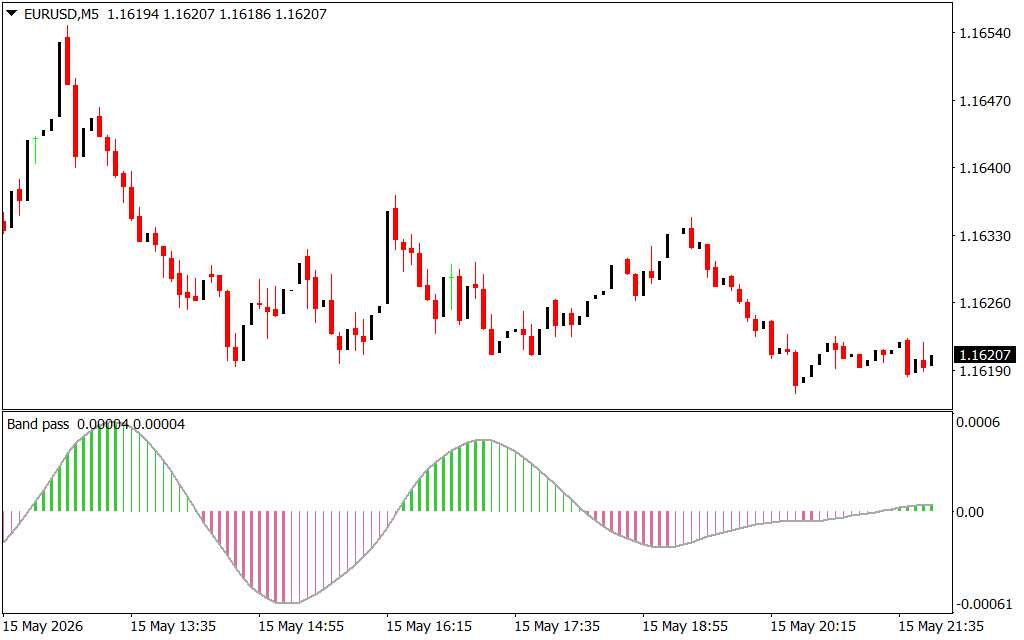
As demonstrated on the EUR/USD M5 chart, the indicator runs smoothly in a dedicated sub-window beneath the Price Action, ensuring your primary chart terminal remains clean and uncluttered. It displays its data using a zero-line oscillator combined with a dual-colored vertical histogram:
- The Zero-Line Equilibrium ($0.00$): The center line represents the point where a cyclical wave shifts its direction. When the signal line crosses above zero, the upward cycle is accelerating; when it falls below zero, the downward cycle takes over.
- The Green Expansion Bars: When the histogram bars are bright green and rising above the zero line, it signals expanding bullish momentum within the current cycle. Peak heights indicate that the cyclical buying pressure has reached its maximum velocity.
- The Pink Liquidation Bars: When the histogram bars dip below the zero line and turn pink, it alerts you that a bearish cycle is underway. Deep valleys show where selling velocity is at its highest strength.
Strategic Applications for High-Probability Trading
To successfully integrate the Band Pass Filter Indicator into an active trading terminal, implement these structured execution guidelines:
- Precision Cycle Crossovers: Instead of chasing a fast-moving trend, wait for the smooth signal line to cross through the $0.00$ axis. A clean shift from pink to green bars confirms the birth of a fresh intraday buying cycle.
- Timing Overextended Reversals: Watch the curvature of the histogram bars. When the green bars stop growing and begin flattening out at a high extreme, it serves as an early technical warning that the current cyclical wave is exhausting itself, allowing you to scale out of long positions before price rolls over.
- Filtering Range Consolidation: During highly directional trends, lower-timeframe cycles will align cleanly with higher-timeframe waves. Use this indicator to time your entries exactly at the troughs of pullbacks within a broader macro trend.
2 Downloads
Last Update:
May 17, 2026 02:00 AM
Published:
Jan 20, 2026 22:53 PM
Category: