Precision Trend Scouting: The Bands Modify RSI Indicator for MT4
The Relative Strength Index (RSI) is an undisputed cornerstone of modern technical analysis. Developed by J. Welles Wilder, it has guided retail and institutional traders for decades in identifying overbought and oversold extremes. However, standard RSI implementations possess a notorious flaw in modern, high-frequency environments: standard horizontal thresholds (like 70 and 30) fail to adapt to changing volatility. During an aggressive institutional trend, a standard RSI can stay locked in an overextended state for prolonged periods, triggering costly false counter-trend entries. The Bands Modify RSI indicator bridges this gap by enveloping standard momentum tracking within dynamic volatility bands.
By replacing static parameters with highly adaptive volatility channels, this premium technical indicator helps day traders and scalpers pinpoint the exact exhaustion points of real-time market cycles.
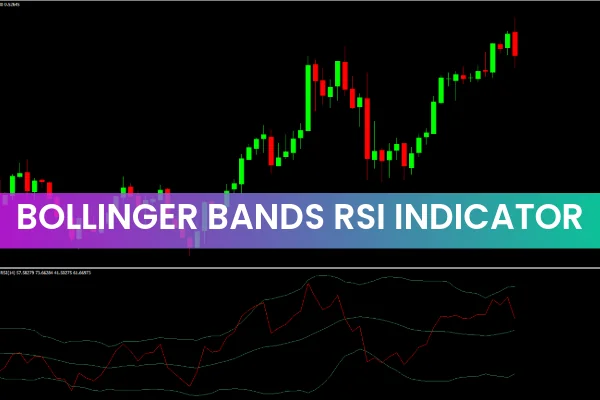
Decoding the Sub-Window: Volatility Bands and Signal Lines
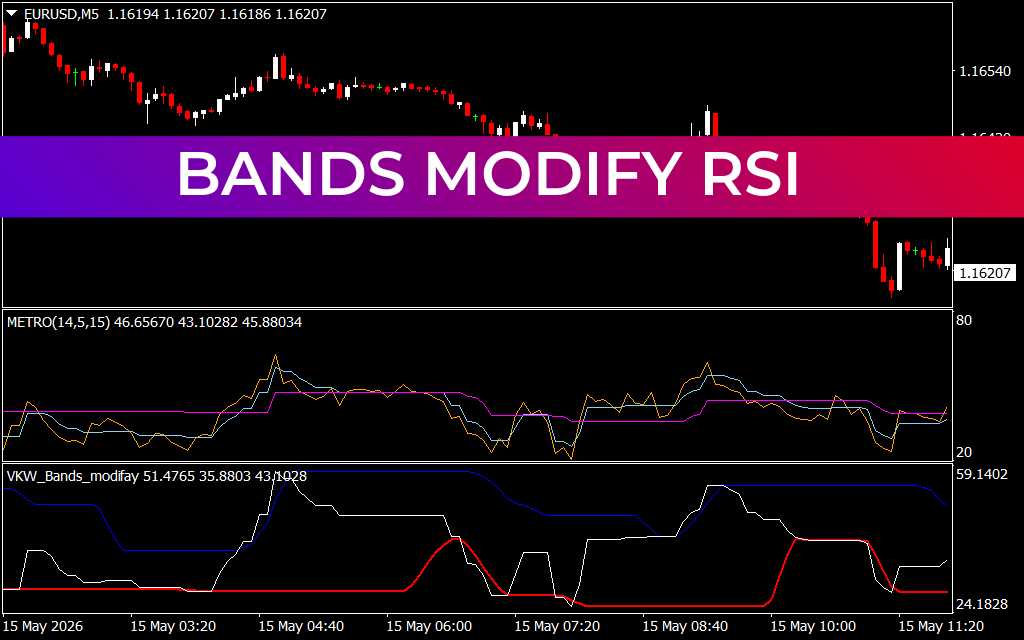
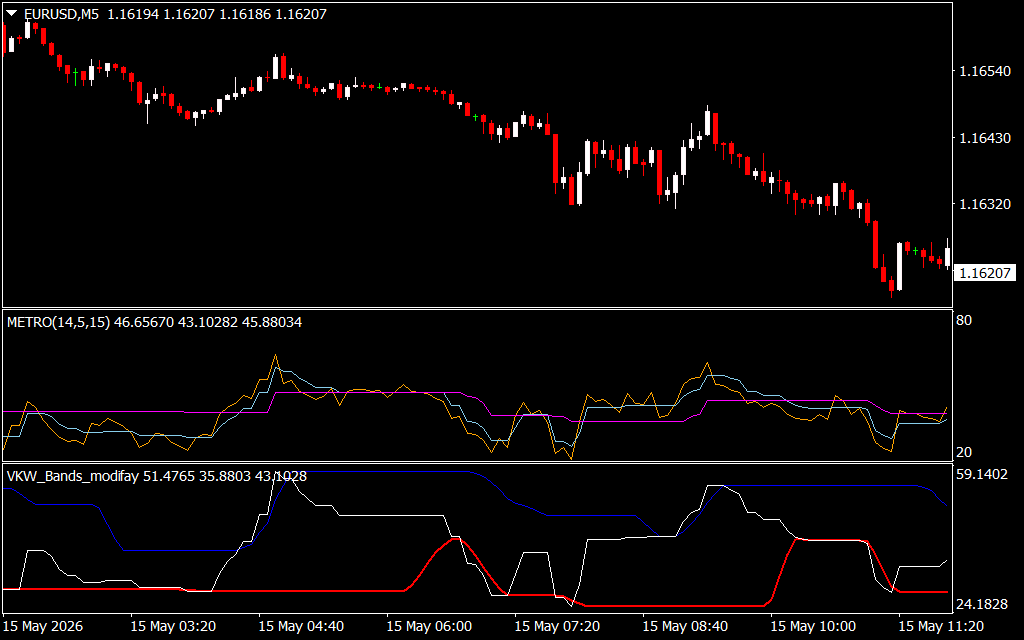
Operating seamlessly out of a dedicated sub-window below your main candlestick screen, the tool transforms classic momentum tracking into a rule-based execution engine. When evaluating liquid pairs like the EUR/USD on a 5-minute (M5) chart, the indicator splits market mechanics into three distinct structural elements:
- The Adaptive Volatility Ceilings (Blue and Orange Boundary Lines): Rather than drawing flat horizontal planes, these outer bands automatically expand and contract based on true market variance. When a rapid upward surge pushes the inner oscillator line against these outer boundaries, it registers a mathematically verified exhaustion zone, signaling a high-probability distribution phase.
- The Dynamic Momentum Core (The White Tracking Line): This highly responsive oscillator measures the internal velocity of Price Action. By tracking how this line reacts near the dynamic boundaries, traders can gauge the true intent of market participants.
- The Institutional Support Baseline (The Red Floor Line): Running along the lower extremes of the layout is a solid red baseline. When the white oscillator drops into this deep compression zone and flattens out, it flags an accumulation phase where big money is absorbing selling pressure, providing an objective green light to hunt for long positions.
Optimizing High-Frequency Scalping Systems
The Bands Modify RSI indicator is meticulously engineered for short-term trading execution, such as 5-minute Scalping and trend-following breakdown systems. It eliminates the ambiguity of retail trading by adjusting its internal sensitivity to match current market conditions.
Instead of guessing if an overbought reading is a trap, you look at the bands. If price triggers a breakout past a key resistance level but the white oscillator remains trapped beneath an expanding blue ceiling, the breakout lacks true institutional expansion. Conversely, catching a sudden mean-reversion move becomes safer; wait for the white line to pierce the lower red baseline and curve upward before executing a sixty-second scalp. By embedding this advanced filter into your MetaTrader workspace, you gain a cleaner, visual approach to risk management that keeps you flawlessly aligned with institutional order flow.
1 Download
Last Update:
May 17, 2026 16:38 PM
Published:
Jan 20, 2026 16:35 PM
Category: