Enhancing Trend Analysis with the MA In Color Indicator
Moving averages are the foundational building blocks of modern technical analysis. From identifying market direction to acting as dynamic Support And Resistance levels, simple and exponential moving averages are universally relied upon by retail and institutional traders alike. However, standard, single-colored lines often force traders to constantly check cross-references or guess precise points of trend deceleration. The MA In Color indicator upgrades this classic tool into a highly responsive, visual trading companion.
What is the MA In Color Indicator?
The MA In Color indicator is a sophisticated modification of the traditional moving average tool optimized for MetaTrader platforms. Instead of displaying a static, uniform line across your chart, it utilizes real-time algorithmic slope detection to shift colors instantly as market momentum changes.
By calculating the rate of change between successive price periods, the indicator alerts traders to critical shifts in trend velocity before they are clearly visible via raw Price Action. This immediate visual feedback eliminates the lag associated with cognitive interpretation, helping traders maintain a psychological edge during high-stress trading sessions.
Reading the Real-Time Color Signals
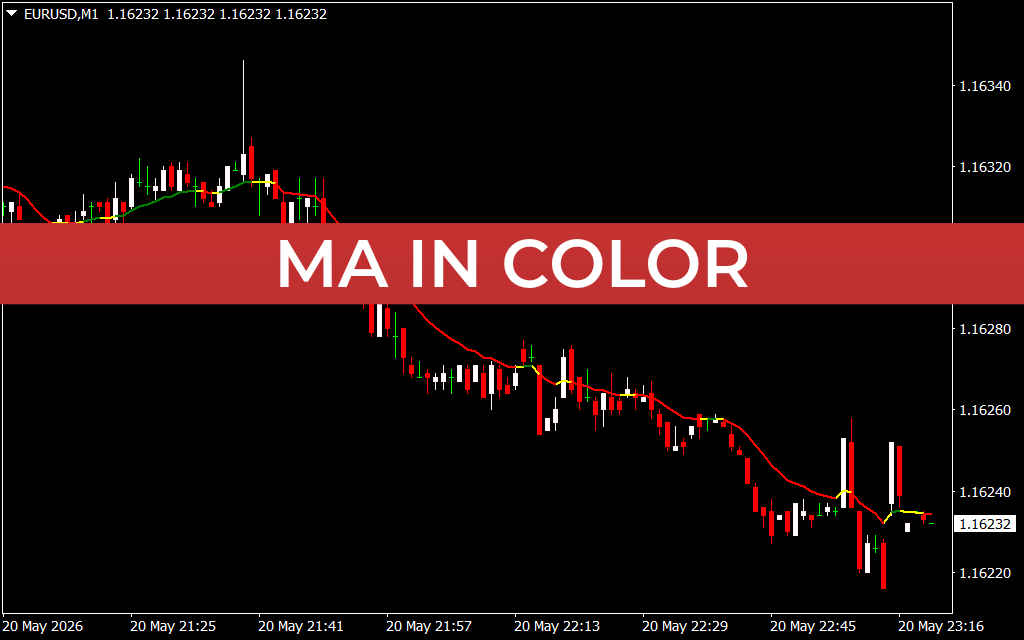
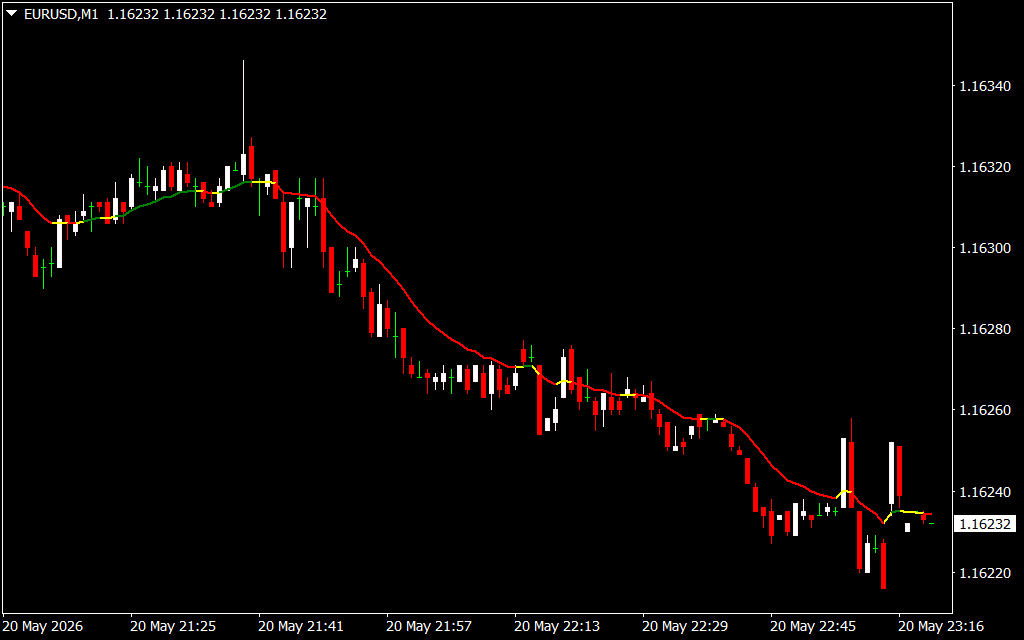
As shown on a 1-minute (M1) intraday chart for major currency pairs like the EUR/USD, the MA In Color plots directly onto the price window, acting as a smooth, dynamic filter for volatile fluctuations:
- Bullish Momentum (Green Line): When the market experiences a sustained upward push, the moving average line shifts to a clean green color. This indicates that the slope is positive, validating long positions and suggesting that pullbacks are potential buying opportunities.
- Bearish Dominance (Red Line): When sellers drive the asset downward, the indicator instantly paints the line red. This negative slope warns traders to avoid buying and focus exclusively on short-selling setups or trend-continuation plays.
- Consolidation and Flattening (Yellow Line): During market transitions or periods of low-volume sideways consolidation, the indicator turns yellow. This serves as a vital cautionary signal that the trend has lost its velocity, advising scalpers and swing traders to tighten risk management or wait for a decisive breakout.
Optimal Strategies for Your Trading Toolkit
To exploit the full power of the MA In Color indicator, integrate it into a disciplined execution plan:
- Intraday Trend Following: Scalpers operating on lower timeframes can use the green and red phases to stay on the right side of the institutional order flow. Avoid entering trades when the line turns yellow, indicating a lack of direction.
- Dynamic Support and Resistance: In a well-defined downtrend, price will frequently rally back up toward the falling red line. When the price touches the MA and bounces lower while the line remains firmly red, it offers a high-probability confluence entry point.
By transforming a static mathematical line into a dynamic visual narrative, the MA In Color indicator simplifies chart reading and helps you execute trades with precision and confidence.
7 Downloads
Last Update:
May 21, 2026 02:25 AM
Published:
Jan 18, 2026 14:11 PM
Category: