Automated Trendline Trading: Maximizing Precision with the SHI Channel Mod Indicator
Identifying the prevailing market trend and its structural boundaries is a fundamental pillar of successful technical analysis. While drawing manual trendlines can be subjective and prone to human error, automated channel indicators bring mechanical consistency to a trader's workflow. The SHI Channel Mod Indicator stands out as an advanced algorithmic tool designed to dynamically map price corridors, helping traders pinpoint high-probability reversal and breakout zones.
By automatically tracking market geometry across various timeframes, this tool provides real-time clarity for scalpers, day traders, and swing traders alike.
The Mechanics of Dynamic Channel Trading
Market prices rarely move in straight vertical lines; instead, they fluctuate within diagonal corridors or channels. A standard regression or equidistant channel requires manual adjustment as new swing highs and swing lows form. The SHI Channel Mod indicator eliminates this lag by continuously scanning the historical Price Action for significant structural pivot points.
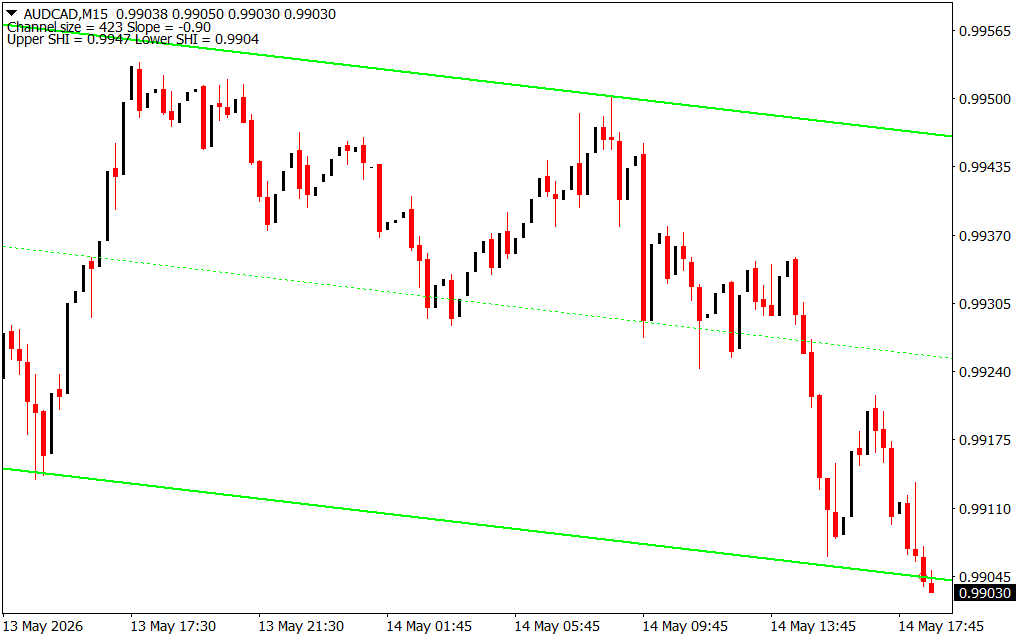
Once these key structural points are identified, the algorithm plots an automated pricing envelope consisting of three vital elements:
- The Upper Channel Line: Acts as a dynamic resistance boundary where buying momentum typically exhausts, presenting prime shorting or profit-taking opportunities.
- The Lower Channel Line: Functions as a dynamic support floor where selling pressure tends to dry up, offering optimal entry points for long positions.
- The Median Line (Dotted): Represents the fair value or equilibrium point of the current trend. It serves as a reliable gauge for momentum—price holding above the median line signals strong bullish intent, while holding below it confirms a bearish bias.
Real-Time Trend Metrics and Analysis
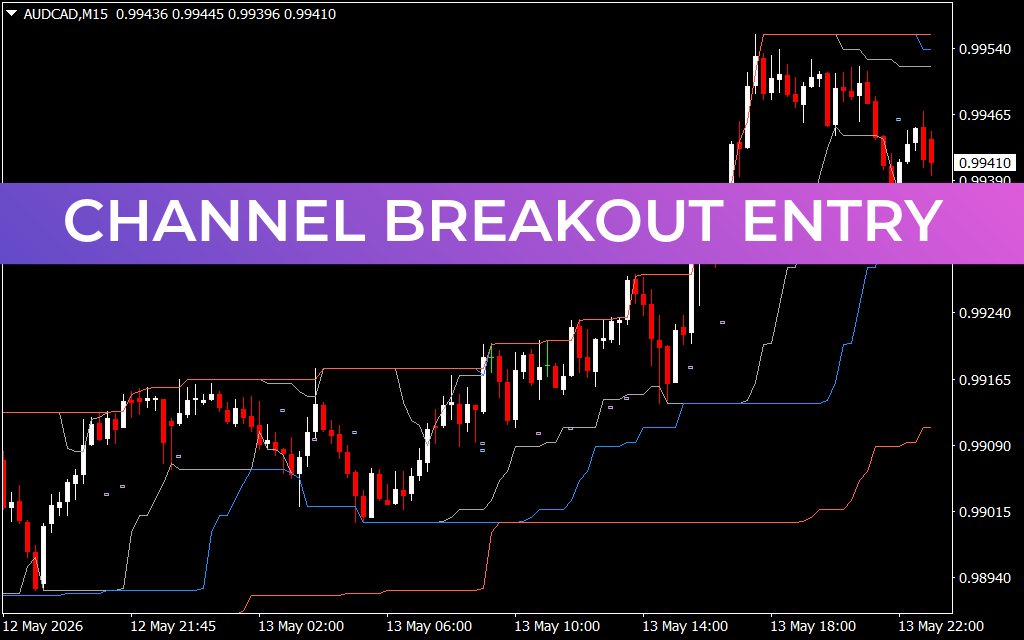
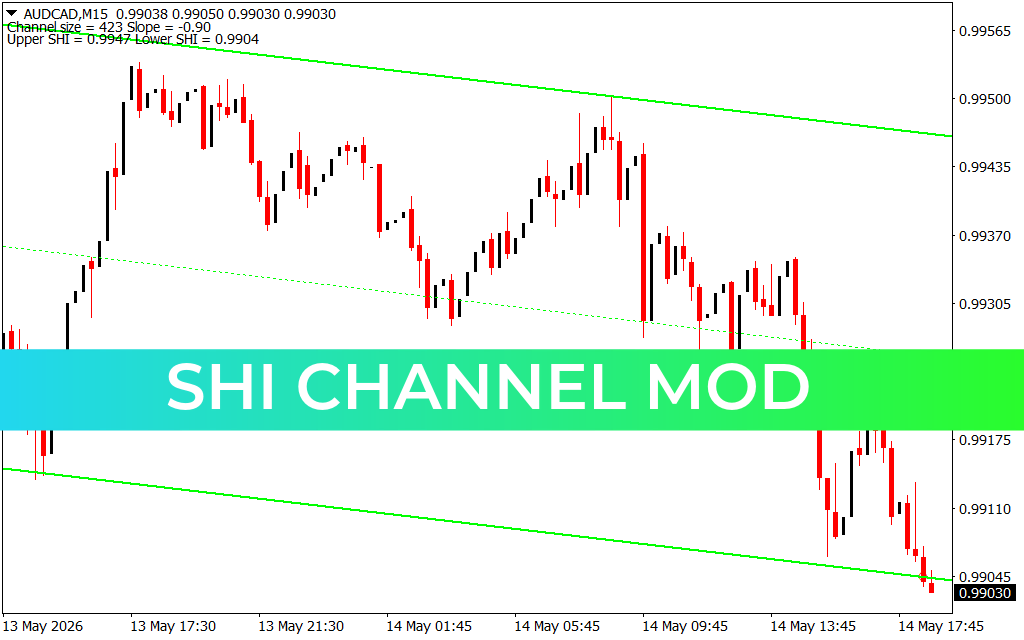
Unlike static indicators, the SHI Channel Mod delivers critical statistical metadata directly to your charting platform. As demonstrated on an AUD/CAD M15 chart, the indicator provides instantaneous readings of the channel's mathematical properties in the top-left corner.
Traders are given the exact Channel Size (e.g., 423 points) and the precise mathematical Slope (e.g., -0.90). A negative slope instantly quantifies a descending bearish channel, reminding traders to prioritize short setups near the upper resistance boundaries or to watch for structural exhaustion at the lower SHI boundaries (such as the 0.9904 support level). This real-time data allows for immediate adaptation to changing market volatility.
Integrating the SHI Channel Mod into Your Strategy
To get the most out of this indicator, it is best utilized alongside classic price action confirmation. When the price approaches the upper or lower green boundaries, traders should look for secondary confirmation—such as candlestick exhaustion patterns, rejection wicks, or momentum oscillator divergences.
For risk management, stop-losses can be placed safely just outside the outer channel bands. This ensures a highly favorable risk-to-reward ratio, as the profit targets can be set at the median line or the opposite channel boundary.
4 Downloads
Last Update:
May 14, 2026 21:48 PM
Published:
Jan 22, 2026 00:38 AM
Category: