Mastering Intraday Overlays: The Basic Hour Indicator for MT4 and MT5
In the fast-paced landscape of day trading, losing track of how Price Action relates to specific time boundaries is a frequent pitfall. For high-frequency scalpers operating on micro-timeframes like the 1-minute (M1) or 5-minute (M5) charts, a single market expansion can look massive, yet mean very little when viewed against the larger hourly structure. To achieve true consistency, retail traders must view lower-timeframe candles through the lens of higher-timeframe boundaries. The Basic Hour indicator serves as the perfect structural utility, plotting dynamic hourly baselines and price steps directly onto your active trading workspace.
By automatically organizing intraday market noise into structured, hourly price matrices, this essential charting tool helps you align your execution strategy with institutional market cycles.
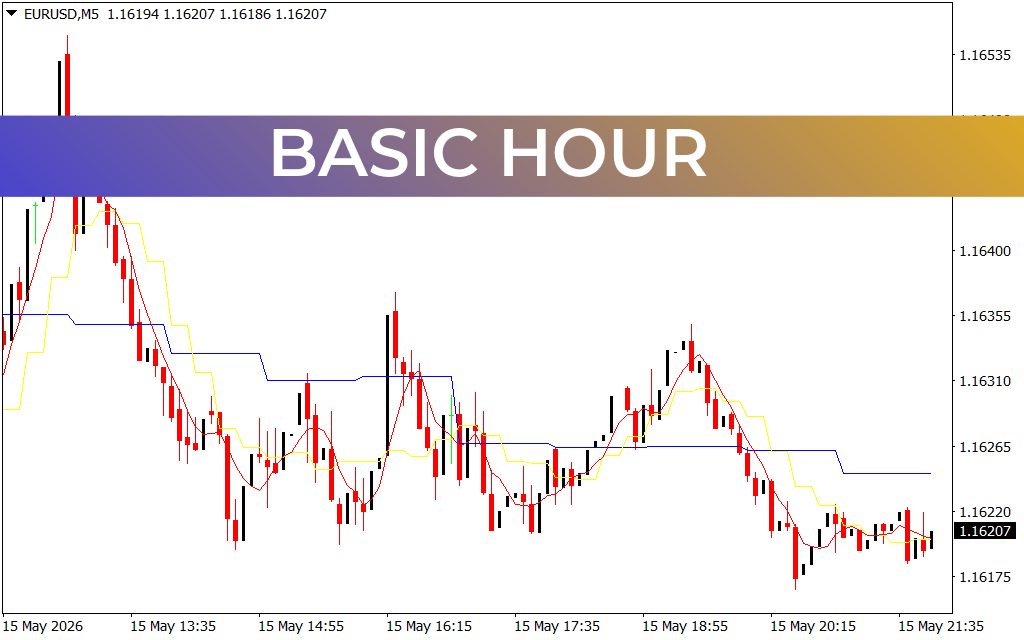
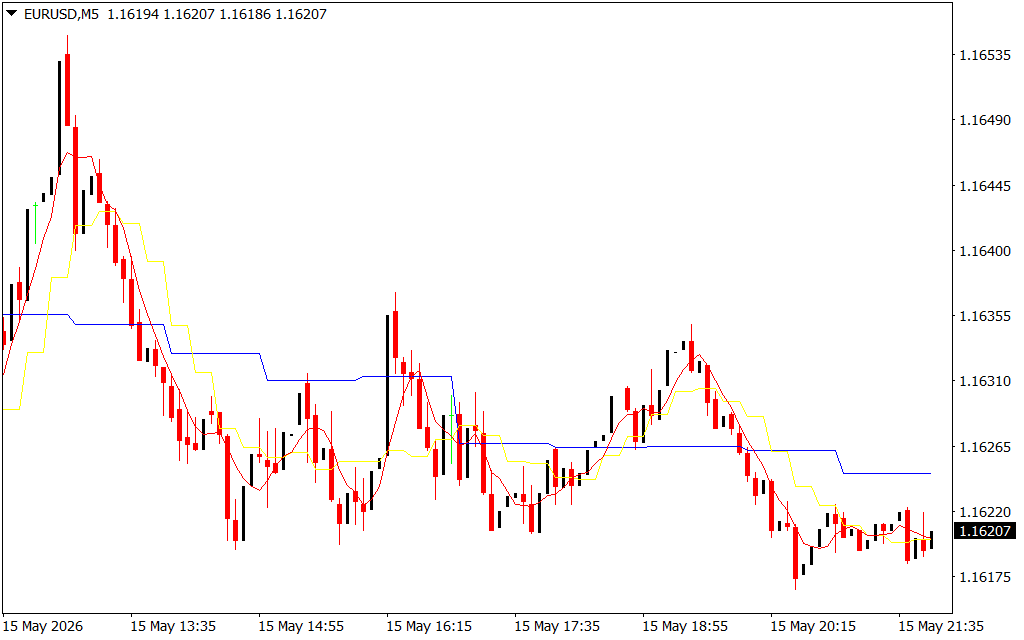
The Anatomy of Hourly Price Matrices
The indicator processes live data and overlays clean, multi-colored stepping lines directly onto your candlesticks. When loaded onto a highly liquid currency pair like the EUR/USD, it establishes an objective visual layout broken down into three core components:
- The Upper Volatility Ceiling (Blue Line): This line maps out the dynamic upper threshold calculated from broader hourly price delivery. When price pushes up against this blue boundary during a lower-timeframe rally, it acts as a structural resistance zone, flagging potential exhaustion or areas where institutional sellers may defend the range.
- The Trailing Median Pivot (Yellow Line): Running through the center of the asset's intraday structure is a stepped yellow line. This line marks the rolling fair-value equilibrium of the recent price blocks. If candles remain sustained above the yellow baseline, bulls hold the immediate intraday micro-bias.
- The Institutional Support Floor (Red Line): Tracking smoothly beneath the price action is a highly responsive red line. As observed during complex retracements, this boundary serves as a dynamic floor. When a downward leg tests the red line and prints a rejection candlestick pattern, it provides an objective signal to hunt for long positions.
Streamlining High-Frequency Strategy Execution
The Basic Hour utility is meticulously engineered for short-term trading styles like sixty-second micro-trades or 5-minute Scalping. It strips away the visual clutter of standard moving averages, replacing them with horizontal price brackets that show exactly how the current candle is performing relative to institutional blocks.
Instead of guessing whether a sudden breakout has real momentum behind it, you check the structural layout. If an aggressive breakdown candle violates a key structural support and is confirmed by a downward step in the blue and yellow trailing lines, you have statistical confirmation to ride the bearish leg. By embedding higher-timeframe metrics directly into your execution screens, this tool prevents you from buying at absolute highs or selling at absolute lows, turning your MetaTrader platform into a definitive asset-mapping environment.
2 Downloads
Last Update:
May 17, 2026 16:31 PM
Published:
Jan 20, 2026 16:52 PM
Category: