Mastering Trend Momentum with the Bay MACD Indicator
In the toolkit of a technical analyst, the Moving Average Convergence Divergence (MACD) is often considered the "king of oscillators." However, standard versions can be prone to "choppiness" in volatile markets. The Bay MACD Indicator is a professional-grade evolution of this classic tool, specifically optimized for MetaTrader 4 (MT4) to provide smoother signals, better noise filtration, and more accurate divergence detection.
What is the Bay MACD?
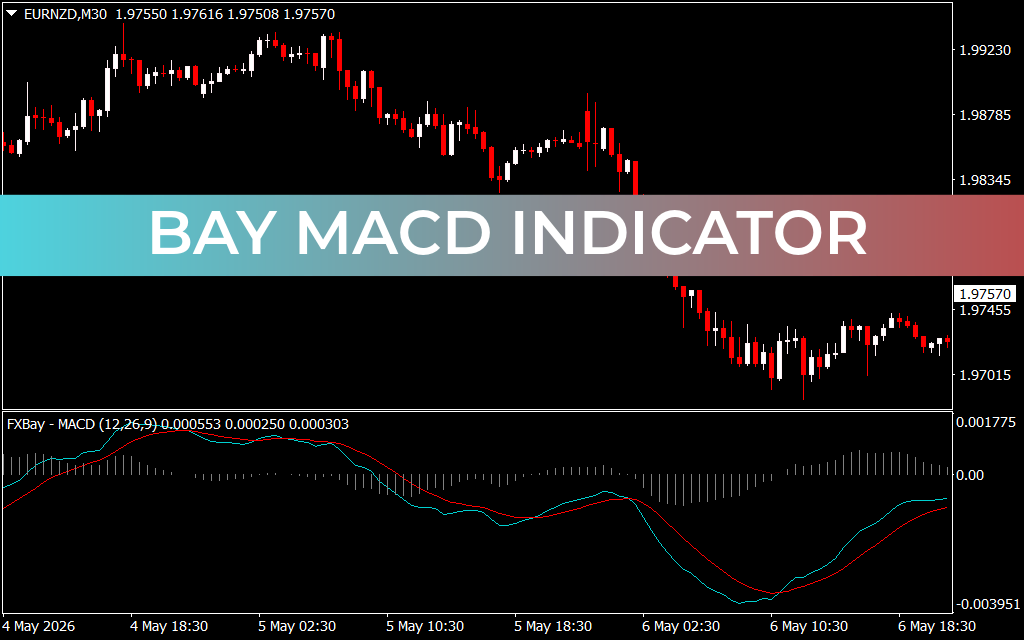
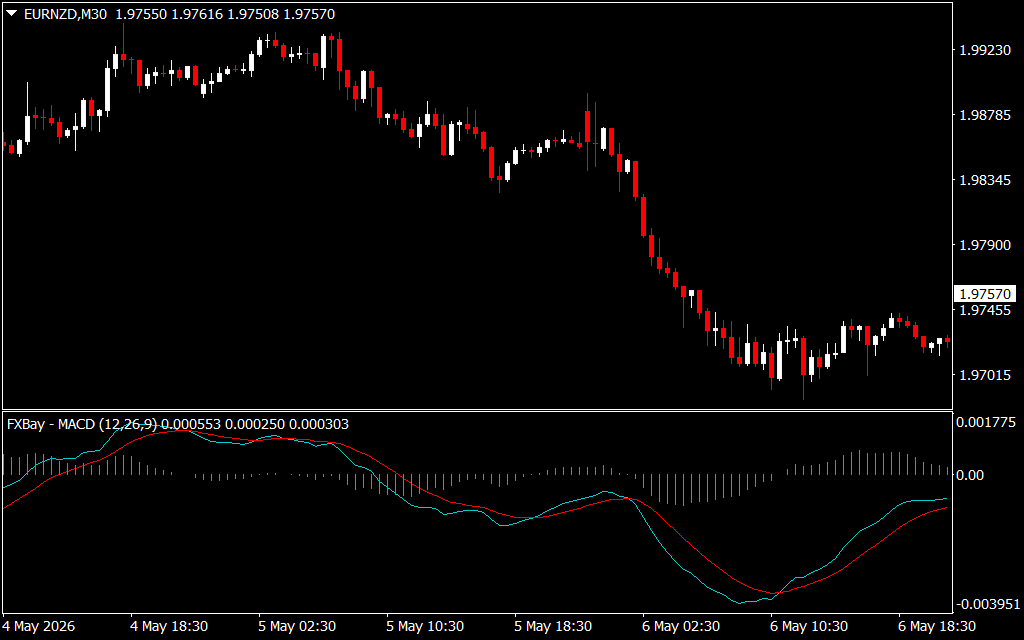
The Bay MACD follows the core logic of measuring the distance between two exponential moving averages, typically the 12 and 26 periods. What sets this version apart is the proprietary smoothing algorithm applied to the signal lines (the cyan and red lines seen in the sub-window). By reducing the "jagged" movements found in default settings, the Bay MACD helps traders stay focused on the primary trend without being misled by minor price retracements.
Key Features for Professional Traders
- High-Clarity Histogram: The vertical gray bars represent the difference between the MACD and its signal line. This visual representation makes it easy to spot when momentum is accelerating (bars growing taller) or exhausting (bars shrinking toward zero).
- Precise Crossover Signals: The interaction between the red and cyan signal lines provides definitive entry and exit triggers. A "bullish cross" below the zero line often marks the start of a new upward cycle, while a "bearish cross" at the peaks signals a potential reversal.
- Superior Divergence Visualization: Divergence occurs when Price Action and the indicator move in opposite directions. The Bay MACD’s smoothed peaks make identifying these high-probability reversal setups significantly easier for the naked eye.
- Trend Filtering: The zero-median line serves as a powerful directional filter. When the indicator is in the positive territory, the bias is strictly bullish; in the negative territory, the bias is bearish.
Strategic Application and Trading Tips
As illustrated in the M30 chart, the Bay MACD excels at capturing medium-term swings. Traders often look for "confluence"—where the indicator crosses the zero line at the same time price breaks through a key support or resistance level.
For scalpers on lower timeframes, the Bay MACD can be used as a "momentum gatekeeper." If the histogram bars are shrinking, it’s a signal to avoid new entries as the market may be entering a consolidation phase. By waiting for the histogram to expand again, you ensure you are trading with the maximum "wind at your back."
Whether you are a trend follower or a reversal specialist, the Bay MACD Indicator provides the mathematical stability and visual clarity needed to make informed decisions in the fast-moving Forex markets.
1 Download
Last Update:
May 08, 2026 19:58 PM
Published:
Jan 25, 2026 21:28 PM
Category: