Precision Trading with the BB MACD Indicator
Technical traders are constantly searching for ways to combine trend direction with volatility analysis. While the standard MACD is excellent for momentum, it often lacks the context of market volatility. The BB MACD Indicator solves this problem by merging two of the most powerful tools in technical analysis: the Moving Average Convergence Divergence (MACD) and Bollinger Bands. This hybrid indicator provides a comprehensive view of the market, helping traders identify high-probability entries while avoiding low-volatility traps.
What is the BB MACD Indicator?
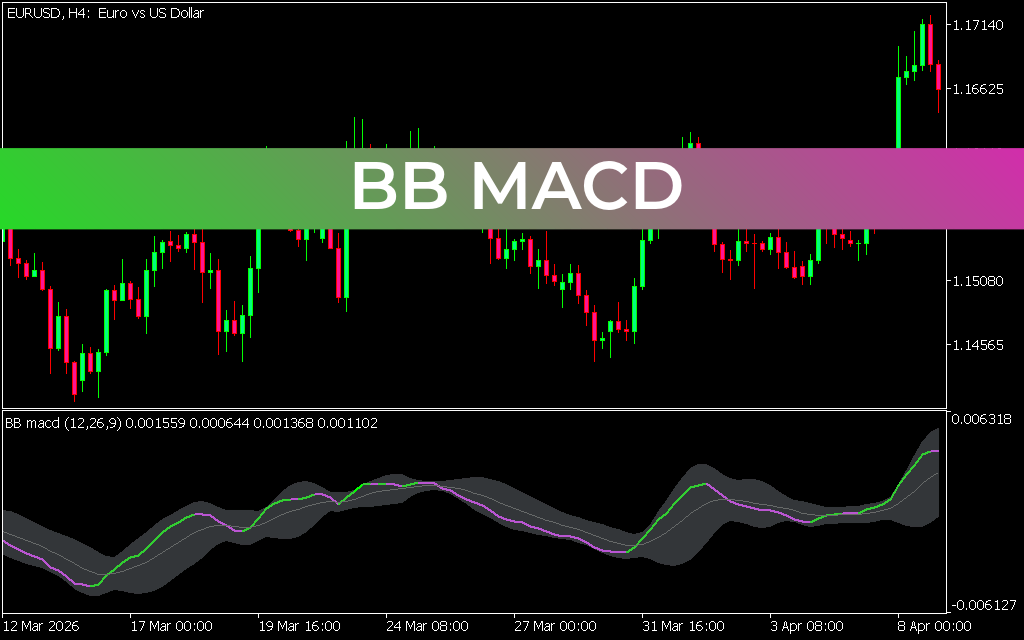
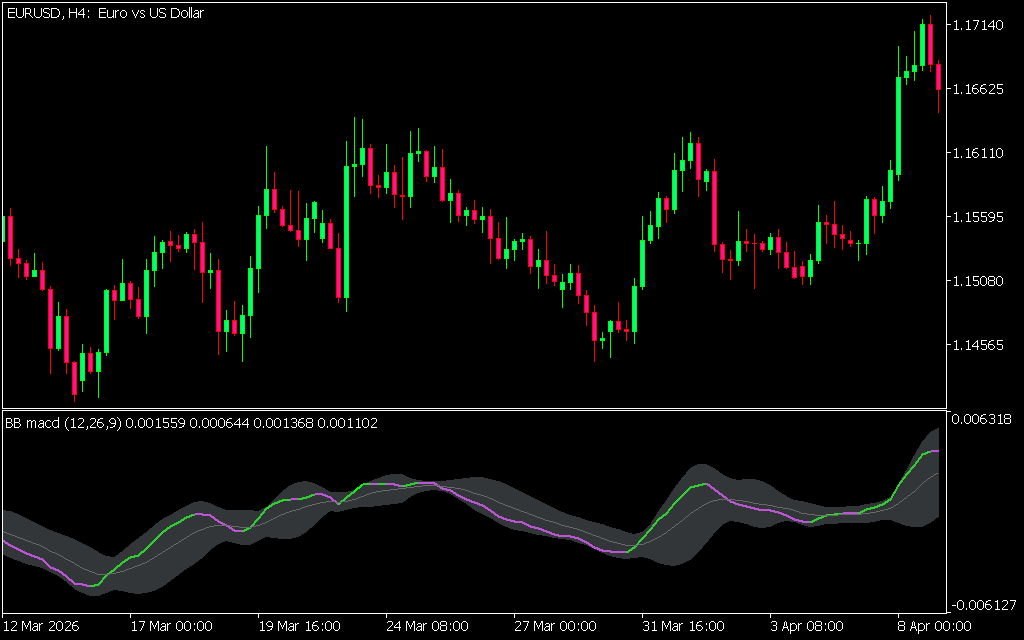
The BB MACD is a variation of the traditional MACD oscillator that incorporates Bollinger Bands directly into its calculation window. Instead of a standard histogram, the indicator typically displays a signal line that changes color based on momentum, plotted within a "volatility envelope." This envelope expands and contracts based on market conditions, providing a visual representation of price strength relative to historical volatility.
Key Features and Market Benefits
The integration of Bollinger Bands into the MACD framework offers several distinct advantages for MetaTrader users:
- Volatility Context: By observing the width of the bands, traders can instantly see if the market is in a "squeeze" (low volatility) or an expansion phase. Trading signals generated during a band expansion are generally considered much stronger.
- Color-Coded Momentum: The indicator line shifts colors—often green for bullish and magenta/red for bearish—allowing for rapid trend identification.
- Trend Exhaustion Alerts: When the MACD line moves outside the Bollinger Bands, it indicates an overbought or oversold condition. A move back inside the bands often serves as an early warning of a Trend Reversal or a deep correction.
- Reduced False Signals: Standard MACD crossovers can lead to "whipsaws" in sideways markets. The BB MACD helps filter these out by requiring the signal to break through the volatility bands before a trade is considered valid.
Strategic Application on the Charts
As illustrated in the EURUSD H4 chart, the BB MACD is particularly effective for swing trading. A common strategy involves looking for the signal line to turn green and break above the upper Bollinger Band to confirm a strong bullish trend. Conversely, a turn to magenta while breaking the lower band confirms a bearish collapse.
Because it captures both momentum and volatility, the BB MACD is an excellent foundation for a complete trading system. It pairs exceptionally well with price action tools like Support And Resistance or Supply and Demand zones. When the indicator shows momentum expanding just as price breaks a key level, the probability of a successful trade increases exponentially.
Conclusion
The BB MACD Indicator is an essential upgrade for any trader relying on momentum oscillators. By adding a layer of volatility analysis to the classic MACD, it provides a more nuanced and accurate picture of market dynamics. Whether you are Scalping the M5 or position trading the Daily charts, this tool offers the clarity needed to stay on the right side of the trend.
3 Downloads
Last Update:
May 09, 2026 11:58 AM
Published:
Jan 25, 2026 12:38 PM
Category: