Advanced Market Timing with the BB OSMA Indicator for MT4
In the pursuit of trading excellence, the ability to identify when a trend is gaining strength or beginning to exhaust is paramount. While standard oscillators like the MACD or moving averages provide a basic foundation, professional traders often require more nuanced tools to filter market noise. The BB OSMA Indicator (Bollinger Bands Oscillator of Moving Average) is a sophisticated hybrid tool designed to provide deep insights into market volatility and momentum shifts simultaneously.
What is the BB OSMA Indicator?
The BB OSMA is an advanced technical utility that combines the momentum-tracking capabilities of the Moving Average of Oscillator (OsMA) with the volatility-sensing properties of Bollinger Bands. In a standard setup, the OsMA measures the difference between an oscillator and its signal line. By wrapping these values within Bollinger Bands, the indicator helps traders visualize not just the direction of momentum, but also its relative intensity compared to historical volatility.
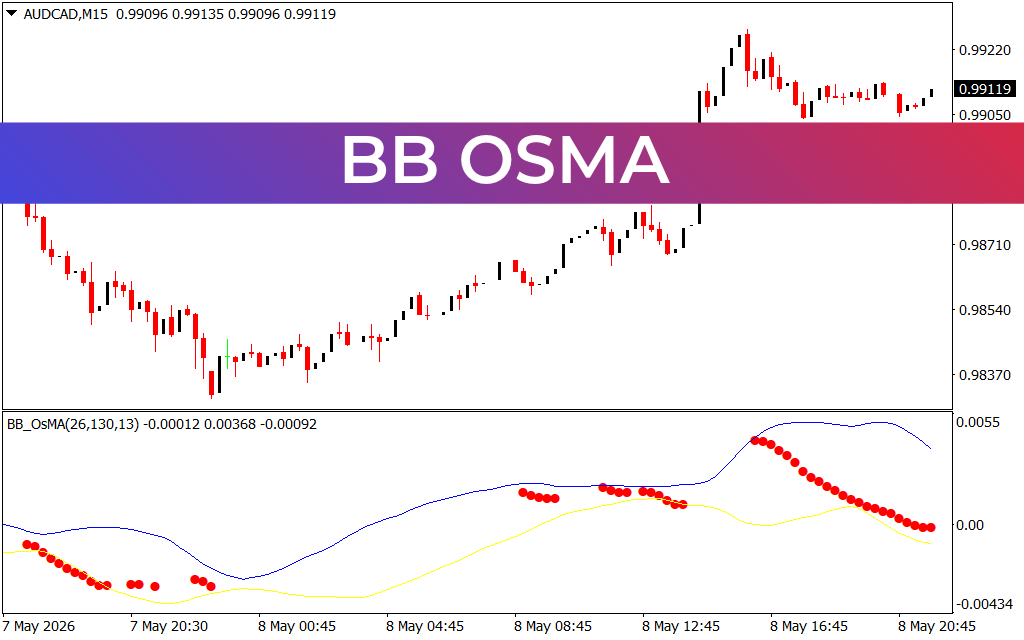
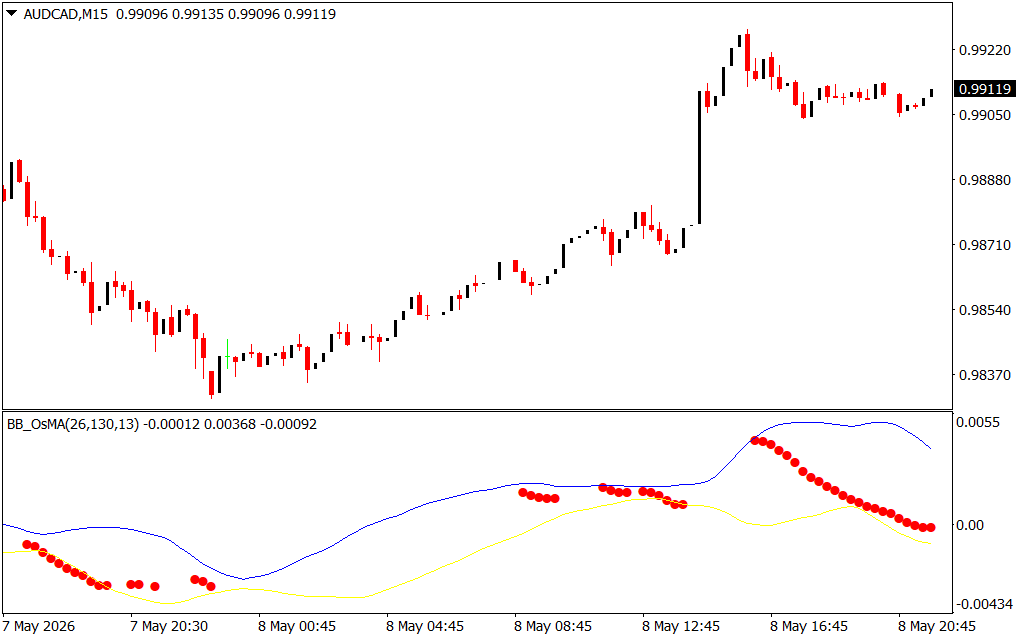
As seen in the uploaded AUDCAD M15 chart, the BB OSMA resides in a sub-window below the Price Action. It typically features a zero line, a set of dynamic volatility bands (blue and yellow), and signal markers—often represented as red or green dots—that indicate specific momentum triggers.
Key Features and Performance Benefits
Traders who integrate the BB OSMA into their MetaTrader platform gain several strategic advantages:
- Volatility-Adjusted Momentum: Unlike standard oscillators, the BB OSMA accounts for market "stretch." When the OsMA dots break outside the blue or yellow bands, it signals that momentum is at an extreme, often preceding a sharp breakout or a reversal.
- Precision Signal Markers: As demonstrated in the M15 example, red dots appearing along the upper or lower bands provide immediate visual cues for trend acceleration or exhaustion phases.
- Noise Reduction: By using the Bollinger Bands as a dynamic filter, the BB OSMA ignores minor fluctuations that might trigger "fakeout" signals in more sensitive, non-banded oscillators.
- Divergence Detection: The indicator is exceptional at spotting classic and hidden divergences. If the price makes a new high while the BB OSMA fails to reach its upper band, a bearish reversal may be imminent.
Strategic Implementation for Day Trading
To maximize results with the BB OSMA, traders should look for confluence between price action and the indicator's components:
- The Overextended Play: When red signal dots form outside the blue volatility band during a steep price climb, it suggests the market is overbought. Traders can look for a move back toward the yellow midline as a primary profit target.
- Trend Acceleration: If the OsMA dots hug the outer bands while the slope of the bands is steep, it confirms a strong, healthy trend. This is the ideal environment for trend-following strategies.
- The Zero-Line Cross: A move from the lower band area through the zero line toward the upper band indicates a significant shift from bearish to bullish sentiment, often used as a core entry signal.
Conclusion
The BB OSMA is a professional-grade indicator that bridges the gap between trend and volatility analysis. By providing a clear visual representation of how momentum interacts with market boundaries, it empowers traders to make more informed, data-driven decisions. Whether you are navigating the intraday M15 charts or analyzing long-term swings, the BB OSMA is an indispensable addition to any technical toolkit.
4 Downloads
Last Update:
May 09, 2026 12:29 PM
Published:
Jan 25, 2026 02:11 AM
Category: