Master Trend Reversals with the Bbr Rsi Overbought Oversold Indicator
Timing market turning points with high precision is one of the most profitable skills an intraday trader can master. However, relying on a single momentum oscillator often leads to false signals during strong, trending market expansions. Traditional tools can remain in overbought or oversold territories for extended periods, trapping counter-trend traders in losing positions. To accurately trade major currency pairs like the EUR/USD, you need a system that confirms momentum exhaustion at structural extremes. The Bbr Rsi Overbought Oversold indicator delivers exactly that by combining classic momentum logic with volatility envelopes.
What is the Bbr Rsi Overbought Oversold Indicator?
The Bbr Rsi Overbought Oversold indicator is a powerful technical analysis tool engineered for modern MetaTrader platforms. It operates as a hybrid trading system, merging the core mathematical strengths of the Relative Strength Index (RSI) with Bollinger Bands (BBR) volatility calculations.
Instead of cluttering your main workspace with multiple overlapping bands and sub-window oscillators, this indicator runs complex standard deviation models behind the scenes. It continuously tracks asset price velocity relative to its dynamic volatility limits. When an asset expands beyond its normal boundaries, the indicator cuts through the market noise and plots clean, actionable signal arrows directly onto your primary candlestick chart.
Key Technical Features and Trading Benefits
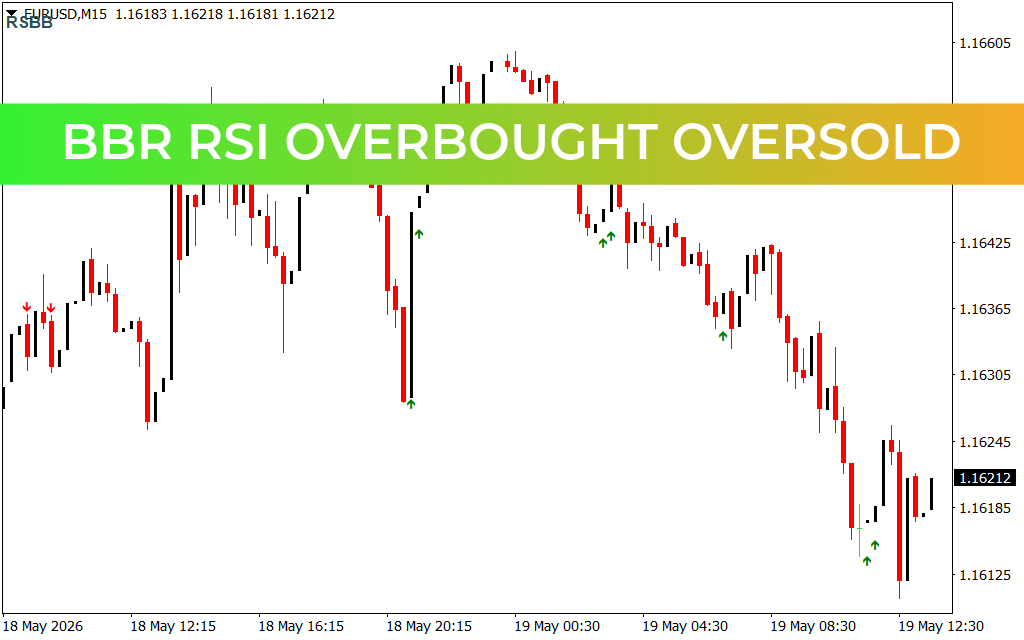
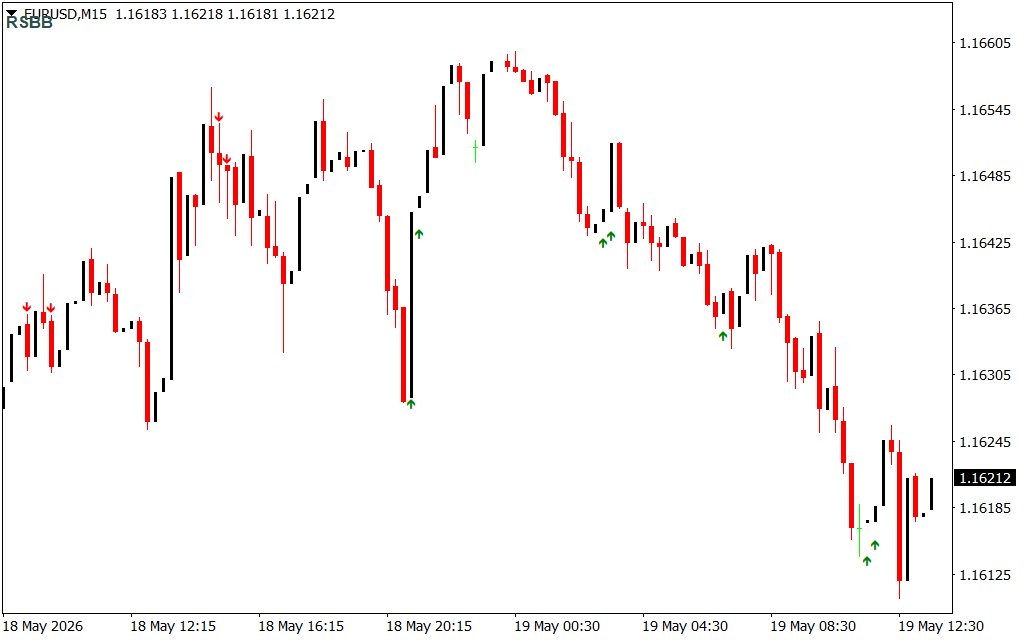
- Precision Arrow Triggers: The indicator removes execution hesitation by printing clear, color-coded visual cues directly on your screen. It displays red downward arrows for short setups and green upward arrows for long entries.
- Dual-Indicator Confluence: By evaluating both momentum velocity (RSI) and structural price deviation (Bollinger Bands) simultaneously, it dramatically reduces the number of false breakout signals.
- Optimized for Intraday Intervals: As demonstrated on liquid mid-tier intervals like the 15-minute (M15) chart, the tool efficiently captures high-probability mean-reversion moves following sharp institutional volume spikes.
- Pragmatic Workspace Setup: The indicator overlays its calculation triggers directly onto standard Japanese candlesticks, keeping your charting workspace clean, organized, and easy to read.
How to Trade with the Bbr RSI Indicator
Using this technical tool successfully centers on capitalizing on rapid price rejections at macro structural boundaries.
- Short Entry Configuration (Overbought): When price surges aggressively into a historical resistance zone, wait for the asset to pierce its upper volatility bands. Once a red downward arrow prints at the top of a candlestick, it confirms that bullish momentum is completely exhausted. Execute a short position at the close of the candle, placing a protective stop-loss just above the local swing high.
- Long Entry Configuration (Oversold): Conversely, during an intense market sell-off into a verified demand block, watch for a green upward arrow to appear at a candle trough. This reveals an oversold structural condition primed for a mean-reversion bounce. Execute a buy order to ride the building upward corrective wave.
Enhance your entry precision and remove subjectivity from your daily analysis by downloading the Bbr Rsi Overbought Oversold indicator today.
2 Downloads
Last Update:
May 19, 2026 16:46 PM
Published:
Jan 19, 2026 17:52 PM
Category: