The DeMark Trendline Trader Indicator for MT4 is a powerful charting tool that automatically plots diagonal and horizontal trendlines to highlight the market’s trend direction. These trendlines act as dynamic Support And Resistance levels, helping traders identify breakouts, reversals, and trend continuation opportunities. The DeMark Trendline Trader Indicator simplifies market structure, making it easier to understand price reactions and potential trading zones right from the first glance.
What Is the DeMark Trendline Trader Indicator?
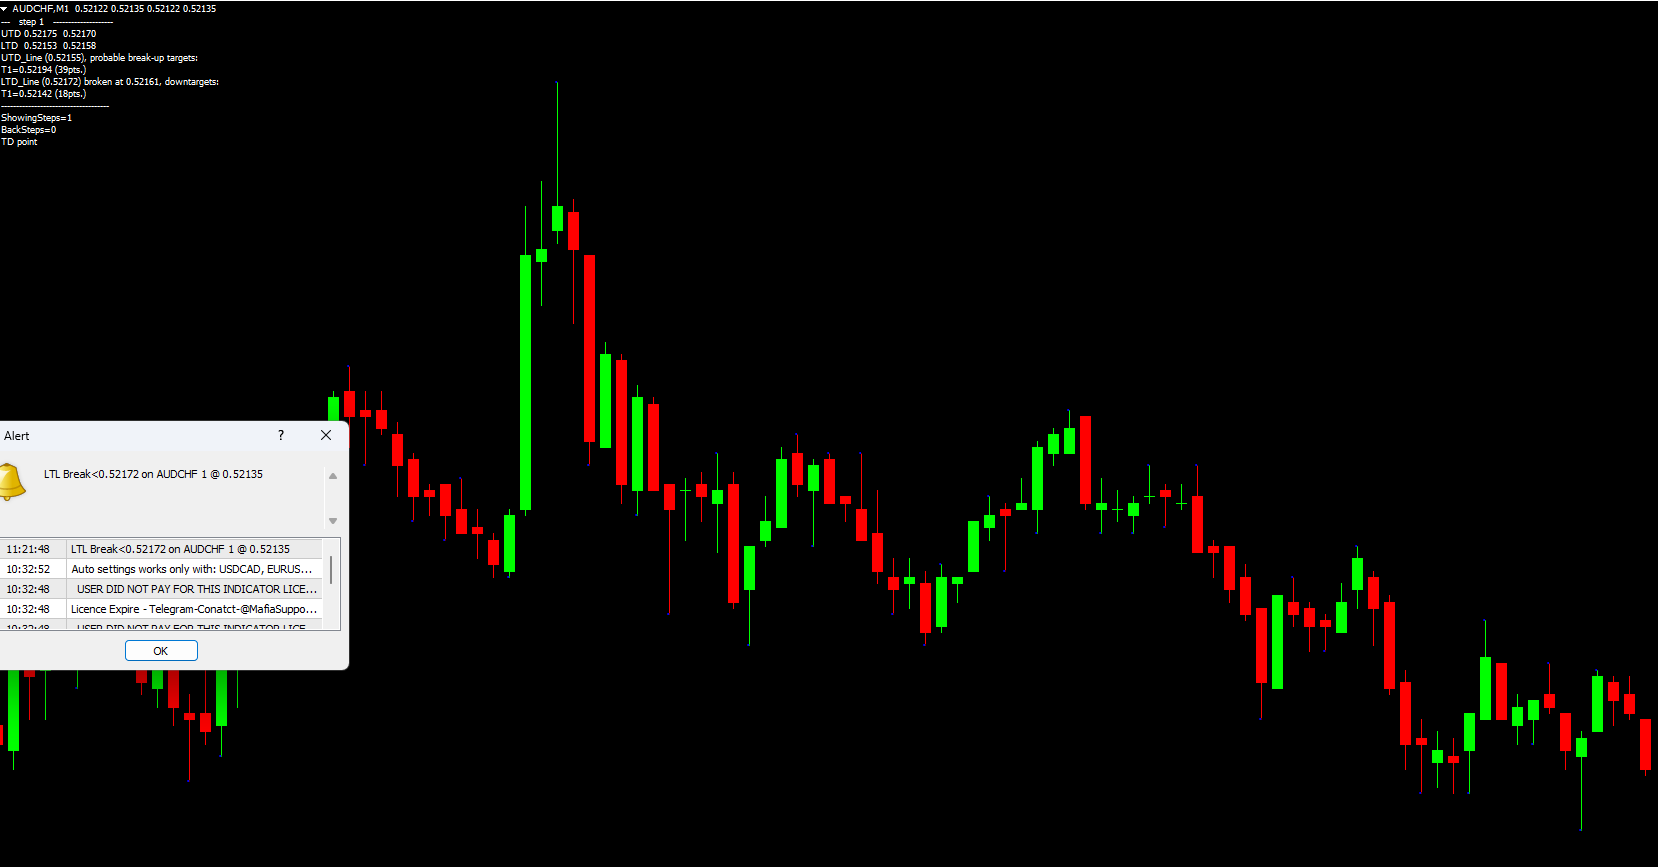
The DeMark Trendline Trader Indicator is built to detect Market Structure using Tom DeMark’s trendline methodology. It draws two diagonal and two horizontal levels on the chart, each color-coded for clarity:
Diagonal Trendlines
Red Line (HL1): Identifies support levels
Lime Green Line (LL1): Identifies resistance levels
These angled lines show the directional trend based on recent swing highs and lows, helping traders visualize trend progression.
Horizontal Trendlines
Green Line (HC1): Represents resistance
Crimson Red Line (LC1): Represents support
These horizontal levels reveal key price areas where the market has historically reacted or paused.
The indicator also displays text information in the upper-left portion of the chart. This includes price levels, support and resistance zones, and potential breakout targets, giving traders an instant understanding of market conditions.
In addition to lines and text, the indicator plots dots above candlesticks that highlight relevant swing points. These markers support trendline formation and help traders confirm structure.
Why Use the DeMark Trendline Trader Indicator?
The DeMark Trendline Trader Indicator is especially useful for traders who prefer structured market analysis without manually drawing trendlines.
Key Advantages
Automatic trendline detection eliminates manual plotting
Support/resistance visualization helps identify breakout zones
Color-coded clarity makes chart reading easier
Superior on higher timeframes like H4, Daily, and Weekly
Works across forex pairs, indices, and metals
Because Tom DeMark’s methodology focuses on price exhaustion and structural shifts, the indicator offers insights that many standard MT4 tools cannot.
BUY and SELL Signals Using the DeMark Trendline Trader Indicator
To use the indicator effectively, traders must pay attention to the diagonal trendlines, as they provide the primary signal direction.
BUY Signal
A red diagonal line (HL1) appears, indicating a support level.
Traders can consider entering long positions when:
Price reacts upward from the red support line
Dots confirm swing points
Horizontal lines show space for an upward breakout
Stop-loss placement is typically set below the support line or the previous swing low.
SELL Signal
A lime green diagonal line (LL1) indicates resistance.
A sell opportunity arises when:
Price rejects or breaks downward from the lime green resistance line
Trendline and dot structure align with bearish conditions
Crimson horizontal support is below, offering profit target zones
Stop-loss can be placed above the resistance swing.
Breakout Identification
The horizontal crimson (LC1) and green (HC1) lines represent potential breakout zones. If one of these lines is missing, traders rely primarily on the diagonal lines for direction.
Breakouts gain more reliability when combined with confirmation tools such as the RSI or MACD, which can signal momentum strength or potential trend exhaustion.
Best Timeframes for the Indicator
The DeMark Trendline Trader Indicator performs best on longer timeframes including:
H4
Daily
Weekly
Short-term charts may generate more false signals due to noise and rapid price fluctuations.
Conclusion
The DeMark Trendline Trader Indicator provides a structured method to identify diagonal and horizontal support and resistance levels. It highlights breakout potential, displays useful price levels, and helps traders understand directional bias. Whether you're analyzing trends or spotting breakout setups, this indicator enhances chart clarity.
For more free MT4 indicators and trading tools, visit IndicatorForest.com today.
FAQ
Published:
Dec 20, 2025 02:36 AM
Category: