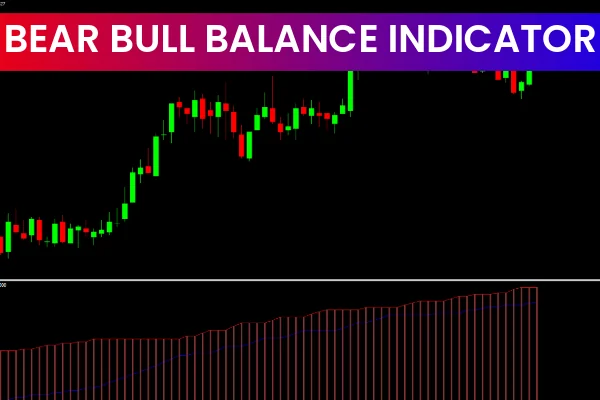
The Bear Bull Balance Indicator for MT4 uses the crossover of bear power and bull power to generate clear bullish and bearish trading signals. By displaying this information as a colored histogram, the indicator helps traders quickly identify market sentiment shifts and momentum strength. It is built around a simple principle:
buy when the bulls dominate, sell when the bears take control.
Because of its simplicity, accuracy, and visual clarity, the indicator is suitable for all levels of traders. It works effectively on all timeframes—from Scalping charts to higher-timeframe swing trading—making it a versatile tool for manual or automated forex strategies.
Bear Bull Balance Indicator for MT4 – Trading Signals
The indicator displays:
Blue line → Bulls power
Red line → Bears power
Gray histogram → Bullish trend
Red histogram → Bearish trend
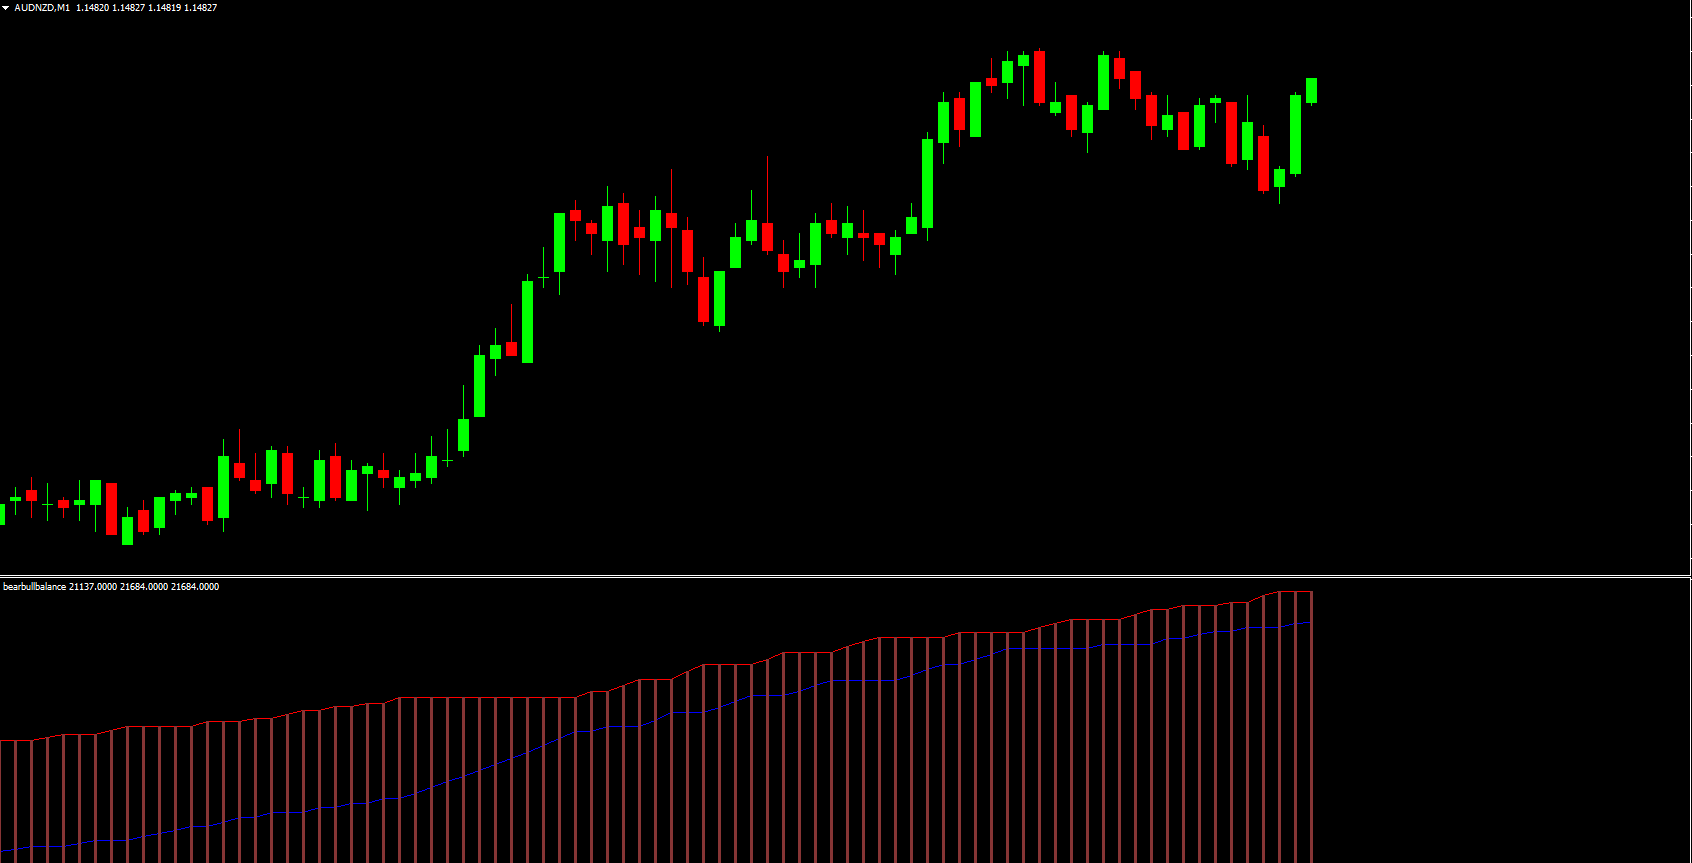
A bullish signal occurs when the blue line crosses above the red line, which causes the histogram to turn gray. This indicates strengthening buying pressure and signals a potential buy entry.
A bearish signal appears when the red line crosses above the blue line, turning the histogram red, signaling potential selling opportunities.
Best trading method:
Enter positions based on histogram color changes:
Gray histogram → Buy, stop below prior swing low.
Red histogram → Sell, take profit on opposite histogram color change.
For better accuracy, traders often combine this tool with RSI, moving averages, or price-action confirmation.
Conclusion
The Bear Bull Balance Indicator for MT4 is a reliable sentiment-based trading tool that helps traders evaluate the strength of buyers and sellers in real time. Its clean visual signals and crossover logic make it ideal for trend trading, reversal identification, and automated strategy development.
FAQ
Published:
Dec 08, 2025 10:44 AM
Category: