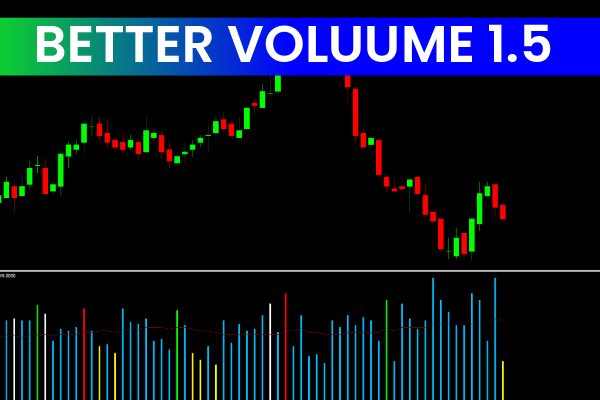
Volume is one of the most overlooked yet powerful components of technical analysis. While price shows where the market has moved, volume reveals the strength behind those movements. The Better Volume Indicator for MT4 unlocks this deeper layer of analysis by color-coding market volume into actionable categories.
By highlighting high-volume climaxes, churn, and low-volume periods, this indicator helps traders spot early trend formation, potential exhaustion points, and moments when the market is preparing for a significant move. It is a refined and improved version of the standard MT4 volume histogram.
How Better Volume 1.5 Improves Standard Volume Analysis
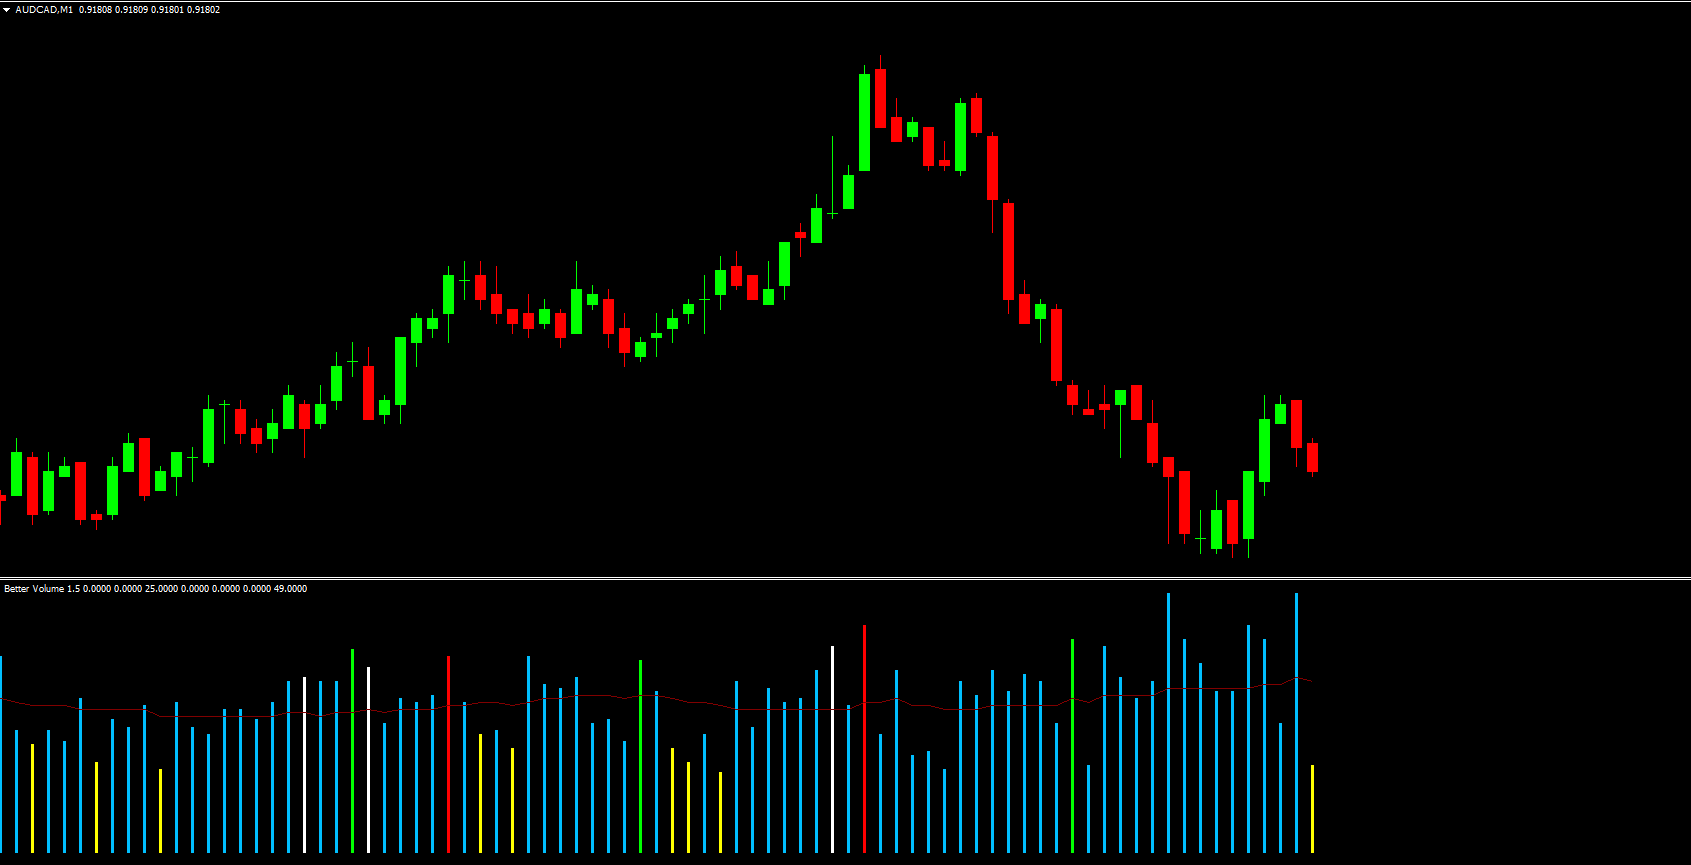
Unlike the standard volume tool that simply displays tick volume bars, the Better Volume 1.5 Indicator breaks volume down into five meaningful categories. Each category is represented with a different color, making the histogram much easier to interpret.
Here are the five volume types included:
Volume Climax Up – Red
This occurs when the market prints unusually high volume on an upward bar with a wide range. It often signals exhaustion or a potential reversal. Red bars may also indicate early momentum in a new bullish push.
Volume Climax Down – White
High volume combined with a broad range on a downward bar signifies strong selling pressure. White bars often appear at the bottom of a move or during market panic.
High Volume Churn – Green (and PaintBar Blue)
High churn means heavy trading activity with a small candle range. This indicates indecision and accumulation or distribution zones. PaintBar mode colors the price bars blue for clarity.
Low Volume – Yellow
Low-volume bars indicate reduced activity and lack of participation. This often appears during consolidation, early sessions, or before major news releases.
Climax + Churn – Magenta
A combination of a climax with churn marks a pivotal market moment where high volume converges with indecision. These magenta signals often appear at key reversals.
Features of the Better Volume 1.5 Indicator for MT4
The indicator offers several powerful features that elevate traditional volume analysis:
Refined Volume Filtering
Better Volume uses a more advanced filtering method compared to the basic MT4 Volume indicator. Instead of simply showing rising or falling tick volumes, it categorizes volume into meaningful market conditions.
Built-In Moving Average
A moving average line overlays the histogram and can act as a secondary confirmation tool. When histogram bars cross above or below the moving average, it may indicate strengthening or weakening market participation.
Dual Purpose Volume Readings
Tick volumes displayed by the indicator can serve as both:
Trading signals indicating momentum shifts
Market information showing the strength or weakness behind the price
This makes it valuable for traders using volume-based strategies or Market Structure analysis.
How the Better Volume Indicator Can Help You
Understanding volume gives traders an edge in timing market entries and exits. The Better Volume Indicator highlights key moments automatically:
Clear Entry Signals
Volume Climax Up often suggests long opportunities, especially following a retracement.
Volume Climax Down frequently signals short entries during trend exhaustion.
These signals appear precisely when market participation is at its peak, giving traders a strong foundation for decision-making.
Improved Market Interpretation
With categorized volume, traders gain insights into:
When trends are gaining strength
When volume dries up, indicating consolidation
When the market enters accumulation or distribution
Whether breakouts are backed by real volume or are likely false
By combining the indicator with price action, moving averages, or Support And Resistance, traders can build a highly accurate and disciplined trading system.
Conclusion
The Better Volume Indicator for MT4 brings clarity and structure to volume analysis by highlighting critical market conditions with easy-to-read colors. Traders can use it to identify turning points, confirm trend
FAQ
4 Downloads
Published:
Dec 11, 2025 08:06 AM
Category: