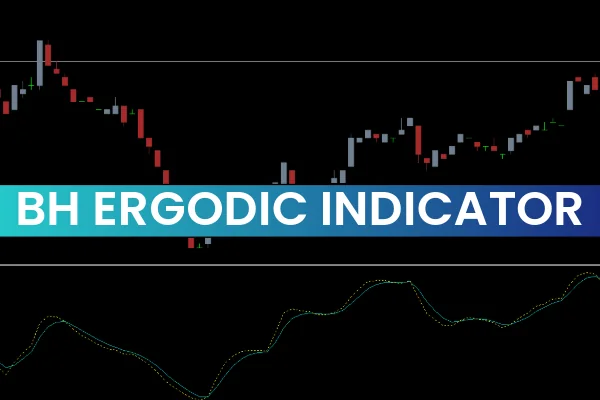
The BH Ergodic Indicator for MT4 is a versatile oscillator designed to help traders identify overbought and oversold zones, as well as trend reversals. It fluctuates around the zero line, providing clear signals for both reversal trading and trend-following strategies.
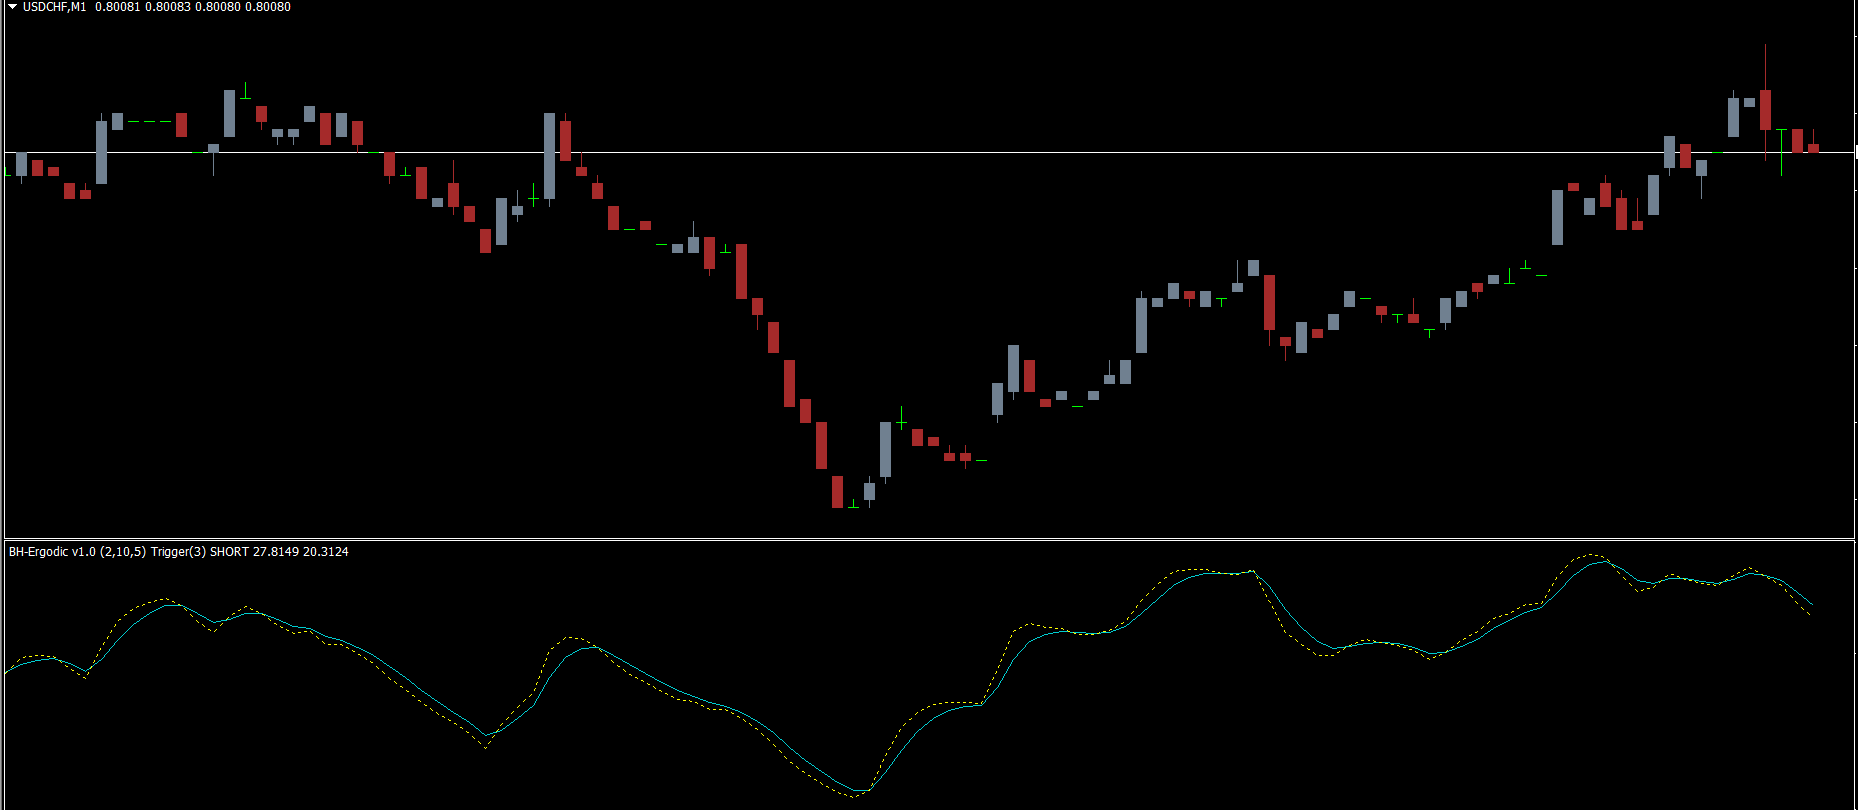
When added to an MT4 chart, the indicator appears in the subwindow under the price bars, displaying two lines that reflect momentum changes. Traders can use these signals to enter high-probability trades in intraday, daily, or weekly charts.
At IndicatorForest.com, you can download the BH Ergodic Indicator for free and start improving your trading decisions today.
How the BH Ergodic Indicator Works
The BH Ergodic is primarily a momentum oscillator, providing signals in two main ways:
Overbought and Oversold Zones:
Above zero: The market is bullish; the indicator may signal a continuation of the trend.
Below zero: The market is bearish; it may indicate a potential short opportunity.
Divergences:
When price rises but the BH Ergodic forms a lower peak, it signals bearish divergence → potential short setup.
When price drops but the oscillator forms a higher low, it signals bullish divergence → potential long setup.
Signals often appear frequently, so it’s recommended to combine them with support/resistance levels, trendlines, or Price Action patterns for higher accuracy.
Trading Strategies Using BH Ergodic
1. Sell Setup (Bearish Reversal):
Observe price making a new high while the BH Ergodic is in the overbought zone.
Look for long upper shadows on price bars.
Place a stop-loss above the previous high.
Hold the position until the oscillator gives a counter signal or use a trailing stop to maximize gains.
2. Buy Setup (Bullish Trend Continuation):
Ensure the market is in a bullish trend.
BH Ergodic should test the zero level.
Look for a bullish engulfment pattern in the price chart.
Place a stop-loss below the low of the engulfment pattern and use trailing stops for capturing maximum trend movement.
3. Intraday and Trend Trading:
Combine BH Ergodic with support/resistance, trendlines, or moving averages for intraday or longer-term strategies.
Use price action patterns to filter signals and reduce false entries.
By following these methods, traders can achieve better risk-reward outcomes while using both reversal and trend-following signals from BH Ergodic.
Advantages of BH Ergodic Indicator
Provides clear buy/sell signals for intraday and longer-term trading.
Identifies overbought and oversold zones effectively.
Helps spot divergences between price and momentum.
Compatible with multiple timeframes on MT4.
Can be combined with other technical tools for enhanced accuracy.
Free to download and easy to install on MT4.
Considerations:
Signals can be frequent; filtering with support/resistance or trend analysis is recommended.
Always use stop-losses to manage risk.
Test strategies on a demo account before trading live.
Conclusion
The BH Ergodic Indicator for MT4 is a reliable and beginner-friendly tool for identifying trend and reversal opportunities in forex, stocks, or other instruments. By combining oscillator signals with price action, support/resistance, or trendlines, traders can spot high-probability buy/sell setups and improve trading performance.
You can download the BH Ergodic Indicator for MT4 for free at IndicatorForest.com and start receiving actionable buy/sell signals today.
FAQ
1 Download
Published:
Nov 11, 2025 23:28 PM
Category: