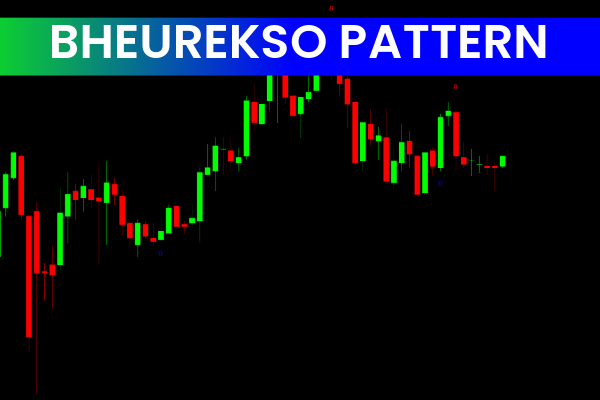
The Bheurekso Pattern Indicator for MT4 is a powerful candlestick pattern detection tool designed to identify trend reversal and continuation setups. By automatically recognizing key candlestick formations, the indicator simplifies technical analysis and helps traders spot potential buy and sell opportunities without the need for manual chart scanning. Suitable for beginners and experienced traders, it is especially effective on higher timeframes such as H4 and D1, making it ideal for day and swing trading.
Features of the Bheurekso Pattern Indicator
Automatic Detection of Major Candlestick Patterns
The indicator continuously scans both historical and real-time price data to identify well-known candlestick formations, including:
Bullish and bearish engulfing
Bullish hammer
Harami patterns
Reversal and continuation candles
These patterns are critical signals for anticipating market direction.
Horizontal Lines Showing Support and Resistance Zones
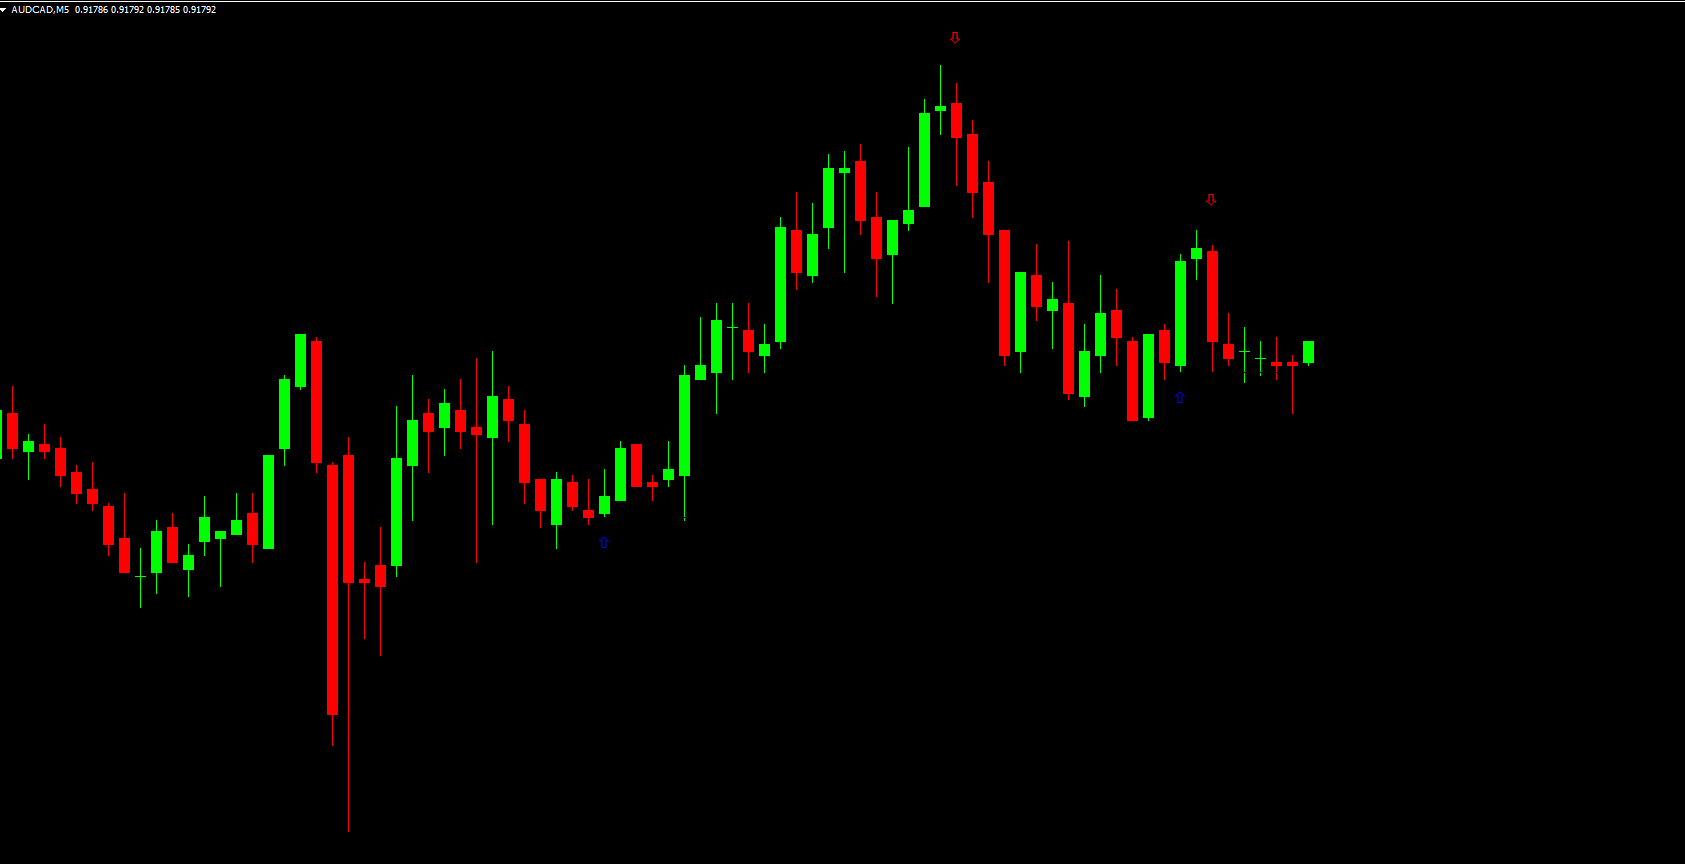
When the indicator detects a candlestick pattern, it plots a horizontal line at the pattern’s price level. These lines highlight potential support or resistance areas, helping traders anticipate where price may reverse or continue its trend.
Clear Buy and Sell Signals
The Bheurekso Pattern Indicator displays buy/sell arrows corresponding to the detected pattern type. These arrows serve as visual prompts for possible entries, giving traders a structured and objective way to analyze market movement.
Built-In Alert System
To enhance convenience, the indicator includes an alert notification system. It informs traders every time a new candlestick pattern forms, ensuring they never miss important setups—even when not actively monitoring the charts.
Benefits of the Bheurekso Pattern Indicator
Simplifies Technical Analysis
Instead of manually analyzing candles across multiple timeframes, the indicator does the work for you. This makes it an excellent tool for traders who prefer quick and reliable pattern recognition.
Ideal for Reversal and Continuation Trading
Candlestick patterns are widely used to predict market reversals or Trend Continuation. The indicator helps you:
Time entries more precisely
Spot early trend shifts
Confirm ongoing trends
Identify high-probability trade setups
Suitable for New and Advanced Traders
Beginners will appreciate its straightforward signals, while advanced traders can combine the patterns with Market Structure or other technical tools for refined entries.
Optimal Performance on Higher Timeframes
The indicator performs best on H4 and D1 charts, where candlestick patterns carry more weight and reduce market noise. This makes it perfect for:
Day traders
Swing traders
Longer-term position traders
Enhances Decision-Making
By marking significant candle formations and plotting key levels, the indicator gives traders the clarity needed to make more confident and disciplined decisions.
Practical Ways to Use the Indicator
Combine With Trend Analysis
Use the indicator alongside moving averages, trendlines, or support/resistance to validate patterns.
Look for Breakouts or Pullbacks
Horizontal lines created by the indicator can act as breakout or pullback levels. Price reacting to these lines often indicates strong movement.
Trade Only Confirmed Patterns
Candlestick patterns gain strength when confirmed by market momentum, structure, or volume. Pairing the indicator with other tools improves accuracy.
Final Thoughts
The Bheurekso Pattern Indicator for MT4 is an excellent tool for identifying candlestick-based trading opportunities with clarity and precision. From pinpointing pattern levels to triggering visual and alert-based signals, it streamlines the entire analysis process and makes trading more efficient.
To access more professional MT4 indicators and trading tools, visit IndicatorForest.com and elevate your trading strategy today.
FAQ
5 Downloads
Published:
Dec 11, 2025 22:21 PM
Category: