Navigate Market Volatility with the Murrey Levels Indicator
Predicting where a price trend will stall or reverse is the ultimate goal of any technical analyst. While many traders rely on subjective trendlines, the Murrey Levels indicator offers a highly objective, mathematical framework based on the legendary principles of W.D. Gann. By dividing price action into a harmonic grid of eight equal intervals, this indicator provides a clear roadmap of Support And Resistance that adapts to any timeframe or asset class.
The Mathematics of Harmonic Support and Resistance
The Murrey Levels system is built on the theory that all markets move in predictable geometric proportions. The indicator identifies a significant price range (a "square") and divides it into 1/8th intervals. Each level within this grid has a specific personality and statistical likelihood of influencing Price Action.
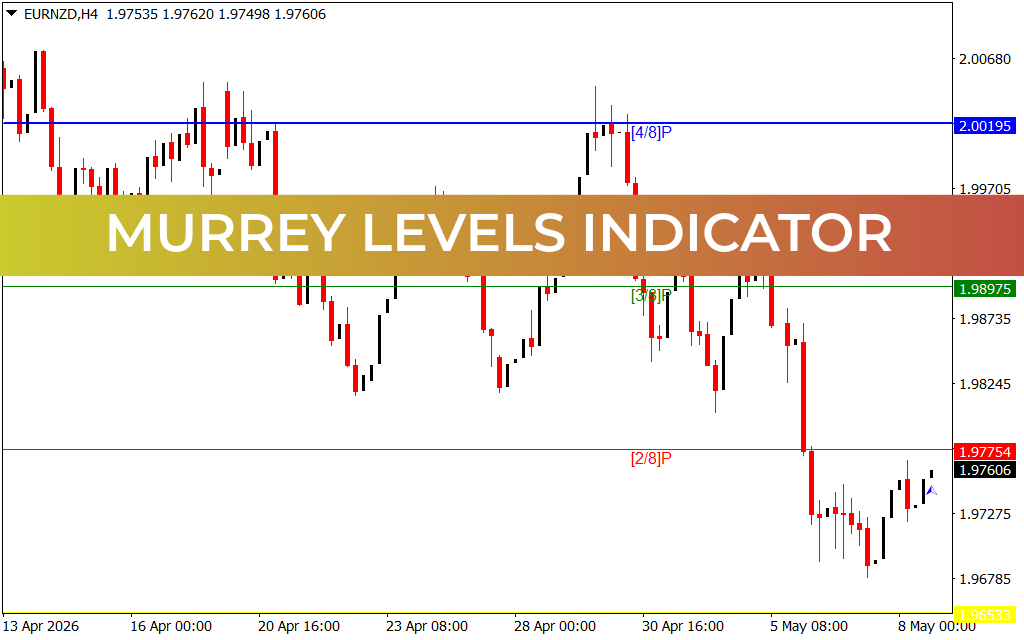
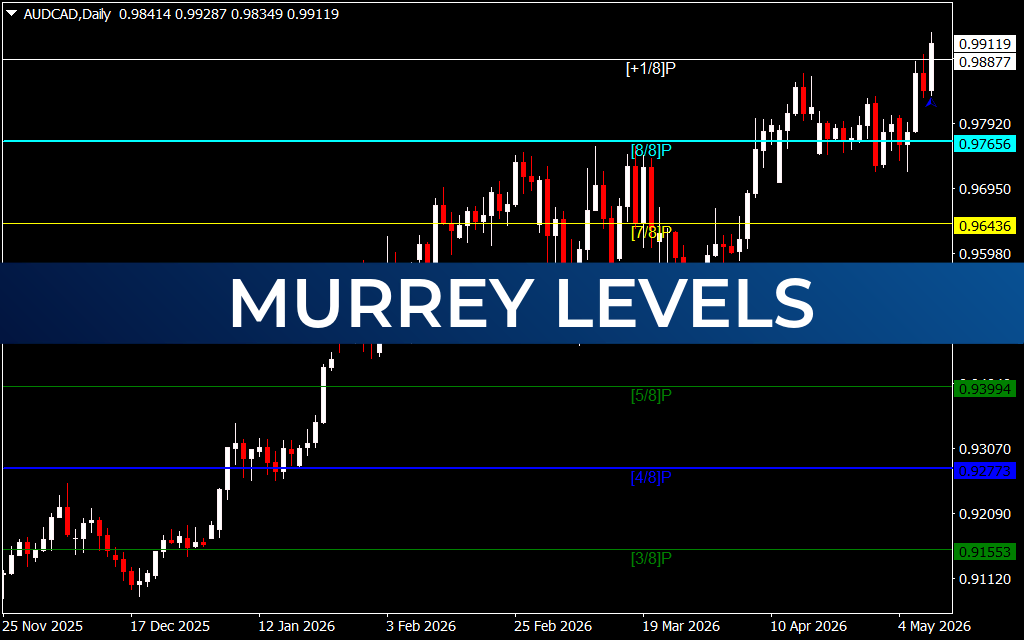
As seen on the AUD/CAD M1 chart, these levels are plotted as horizontal lines that act as psychological magnets for price. Unlike standard pivot points that change daily, Murrey Levels provide a consistent structural view of the market, identifying where the price is "cheap," "expensive," or in a state of equilibrium.
Key Features and Strategic Advantages
- Objective Price Geometry: Murrey Levels remove human emotion from charting. The grid is calculated purely on mathematical ratios, ensuring you are looking at the same structural levels as professional institutional desks.
- Defined Trading Zones: The indicator categorizes levels into specific roles. For example, the 4/8 line acts as the "Major Support/Resistance" or the equilibrium point, while the 0/8 and 8/8 lines represent the "Hardest Support" and "Hardest Resistance."
- Overextension Alerts: Levels like +1/8 and +2/8 (or -1/8 and -2/8) identify extreme conditions where the market is severely overbought or oversold. These are prime zones for anticipating major trend reversals.
- Universal Applicability: Whether you are a scalper trading the M1 AUD/CAD chart or a swing trader on the Daily timeframe, the harmonic math remains valid, providing a reliable framework across all timeframes.
- Clean Visual Execution: The indicator provides a comprehensive market map without the need for multiple overlapping tools. It consolidates trend, momentum, and structural analysis into a single, easy-to-read grid.
Strategic Implementation: The Reversal Play
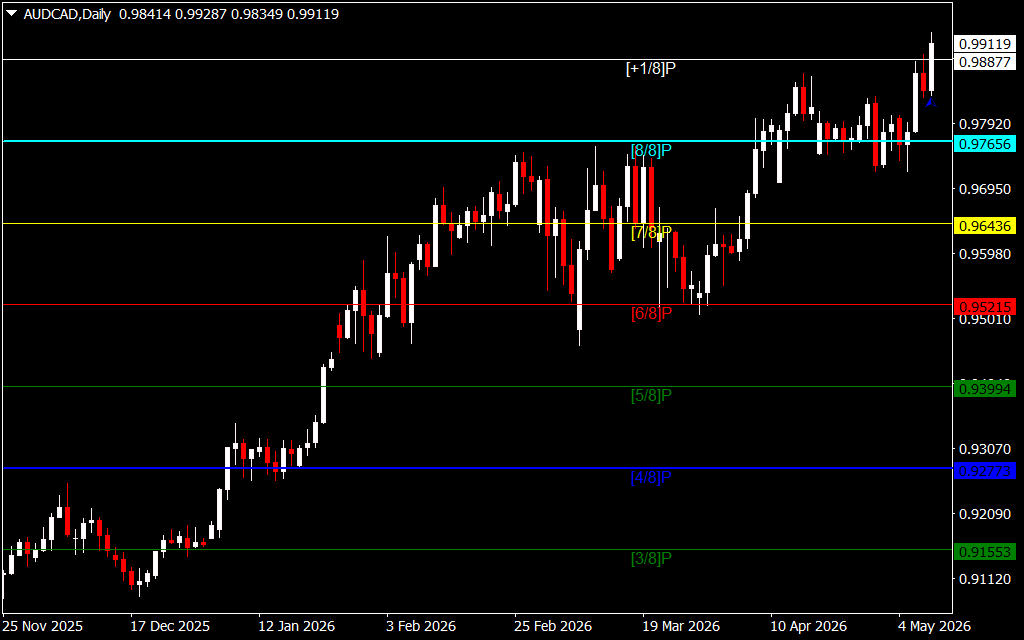
The most powerful way to trade with Murrey Levels is by identifying Extreme Rejections. When price penetrates the 0/8 or 8/8 lines, it has reached its mathematical limit for the current cycle. If a price action signal, such as a pin bar, forms at these "Hardest" levels, it indicates a high-conviction opportunity for a reversal back toward the 4/8 median line.
Traders also use the 1/8 and 7/8 levels as "Weak" support and resistance. If price breaks through these levels decisively, it often signals a "breakout" move toward the next major 1/8th interval, allowing trend followers to ride the momentum with clear profit targets.
Conclusion
To succeed in the Forex market, you need a map that doesn't change with every minor fluctuation. The Murrey Levels indicator provides that map, grounded in the timeless geometric laws of market movement. By understanding the specific role of each harmonic interval, you can anticipate market turns with surgical precision. Elevate your MT4 platform today and start trading with a structured, mathematical advantage.
2 Downloads
Last Update:
May 10, 2026 02:15 AM
Published:
Jan 24, 2026 15:35 PM
Category: