Mastering Market Geometry with the Murrey Levels Indicator
In the complex world of technical analysis, many traders struggle to identify where a trend will truly end or where a reversal is mathematically likely. Traditional Support And Resistance are often subjective, but the Murrey Levels Indicator provides an objective, fractal-based framework for understanding Price Action. Based on the principles of W.D. Gann, Murrey Math assumes that the market moves in predictable, harmonic intervals.
What is the Murrey Levels Indicator?
The Murrey Levels Indicator divides any given price range into nine equidistant horizontal lines, creating eight distinct intervals. These levels, ranging from 0/8 to 8/8, act as the most significant psychological and mathematical barriers in the market.
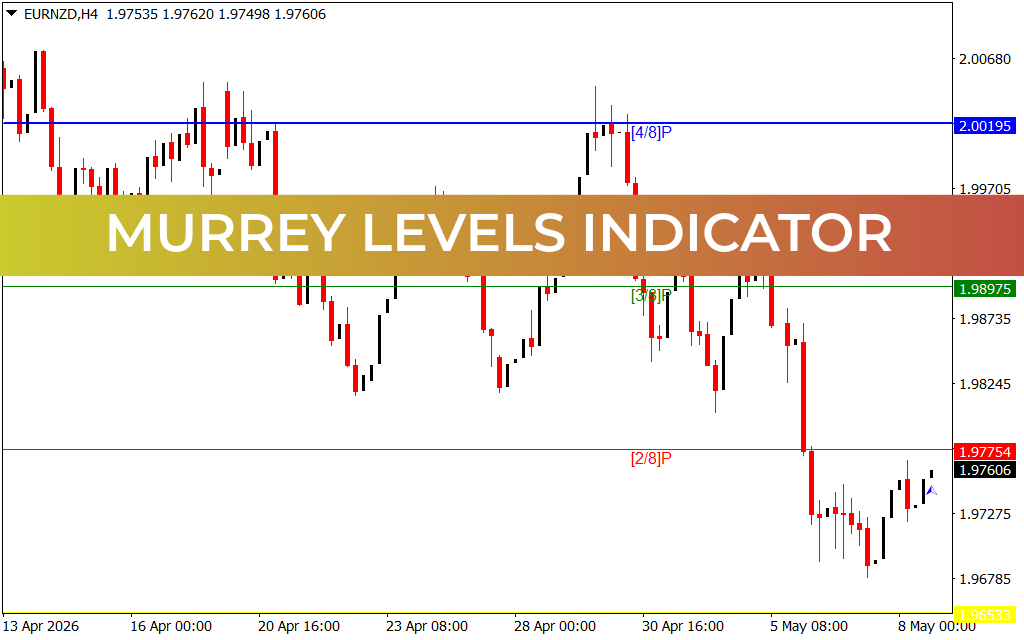
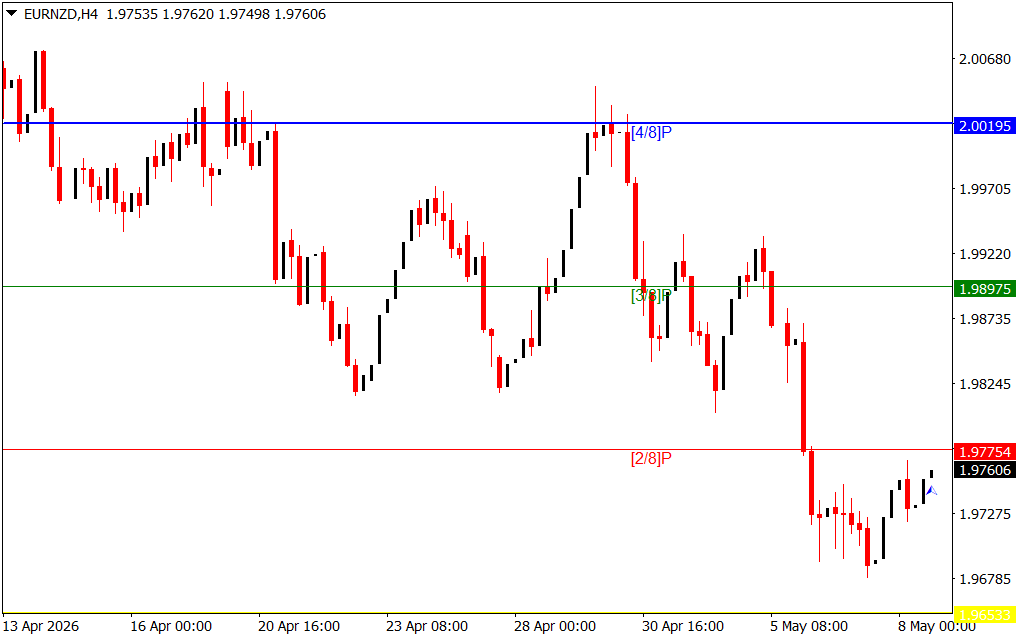
As seen on the H4 chart, the levels provide a clear hierarchy of price significance:
- [4/8] Major Support/Resistance: This is the most critical level on the chart. If price is above it, the market is bullish; below it, the bias is bearish.
- [0/8] and [8/8] Hardest Resistance: These represent the ultimate boundaries of a range. Reversals are highly probable when price reaches these extremes.
- [2/8] and [6/8] Pivot Points: These often act as secondary reversal points or major "pause" zones during a strong trend.
Key Trading Advantages
- Objective Decision Making: Murrey Math eliminates the guesswork. You no longer have to wonder where to draw your lines; the indicator places them based on strict mathematical ratios.
- Fractal Nature: The indicator works identically across all timeframes. Whether you are a scalper on the M1 or a swing trader on the Daily chart, the [4/8] level remains the "center of gravity."
- Anticipatory Analysis: Unlike lagging oscillators, Murrey Levels are leading indicators. They tell you where the "walls" are before price even reaches them.
- Exit and Entry Precision: The levels provide natural locations for take-profit targets and stop-loss placements, helping traders maintain a disciplined risk-to-reward ratio.
How to Trade with Murrey Math
The most common strategy involves trading the "overshoot." When price moves into the "Extreme Oversold" (-1/8 or -2/8) or "Extreme Overbought" (+1/8 or +2/8) zones, it is mathematically due for a regression back toward the [4/8] median.
Traders also look for "rejection clusters." In the provided chart, notice how price reacts violently to the [2/8]P and [4/8]P levels. When a candle closes back within a level after a temporary breach, it confirms that the "Smart Money" is defending that price point. By combining Murrey Levels with price action patterns or volume analysis, you can develop a robust, high-probability trading system.
6 Downloads
Last Update:
May 08, 2026 20:00 PM
Published:
Jan 25, 2026 21:26 PM
Category: