Master Market Volatility with the Bolinger M2 Indicator
In the world of technical analysis, understanding volatility is the key to identifying high-probability trade setups. While standard volatility tools are a staple for many, the Bolinger M2 Indicator takes this concept a step further. Designed for the MetaTrader 4 (MT4) and MetaTrader 5 (MT5) platforms, this indicator provides a refined perspective on price envelopes, helping traders pinpoint extreme market conditions and potential trend reversals with surgical precision.
What is the Bolinger M2 Indicator?
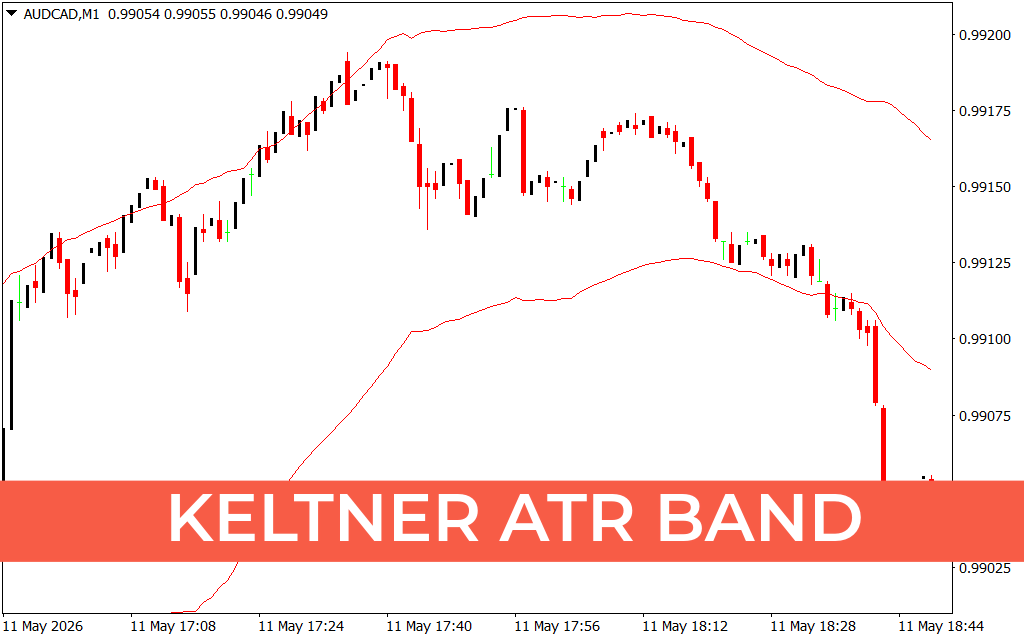
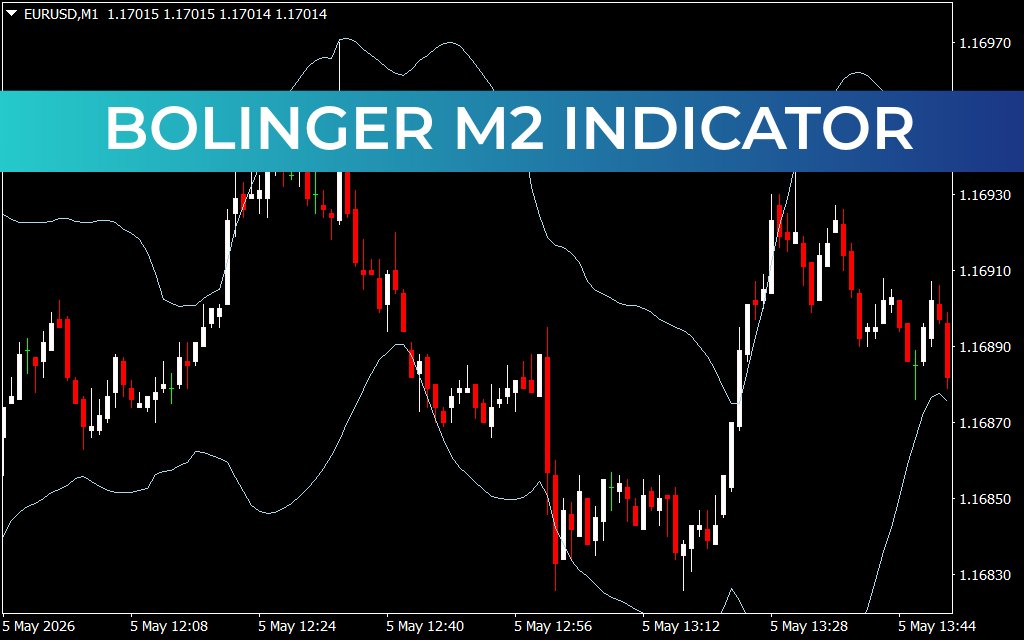
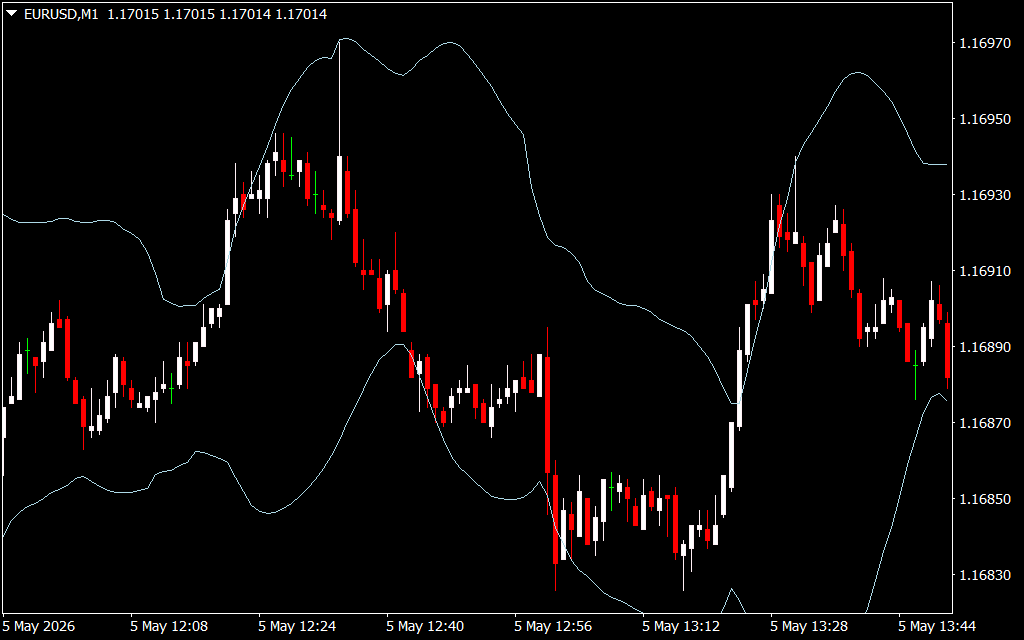
The Bolinger M2 Indicator is an advanced volatility channel tool that plots two dynamic bands around the Price Action. Unlike traditional envelopes that use a simple percentage shift, the M2 variation uses a specialized smoothing algorithm to track price more closely while filtering out market noise. As seen in the provided file EURUSDM1.png, the indicator creates a "channel" that expands during high-volatility periods and contracts during consolidation, offering a visual representation of market energy.
Key Features and Strategic Advantages
- Enhanced Smoothing: The M2 algorithm reduces the "jaggedness" of standard bands, providing a clearer view of the underlying trend direction.
- Dynamic Overbought/Oversold Zones: When price touches or pierces the upper band, the asset is considered statistically overextended to the upside. Conversely, touching the lower band indicates an oversold condition.
- Trend Intensity Visualization: The width of the channel provides immediate feedback on market momentum. A widening channel suggests a strong trend is underway, while a narrowing channel hints at an impending breakout.
- Versatility Across Timeframes: Whether you are focusing on 5 minutes Scalping or long-term swing trading, the M2 adapts its sensitivity to suit your needs.
Practical Trading Insights
Trading with the Bolinger M2 involves looking for price "rejection" at the boundaries. In a ranging market, a common Forex trading strategy is to sell when price touches the upper band and buy when it reaches the lower band.
However, in a trending market, the indicator becomes a powerful tool for momentum trading. If the price "walks" along the upper band without pulling back into the center, it signifies extreme bullish strength. Traders often wait for the price to close back inside the bands as a signal to take profits or anticipate a mean-reversion move.
For those specializing in price action, the Bolinger M2 acts as a secondary confirmation. A bearish engulfing pattern at the upper M2 band carries significantly more weight than one occurring in the middle of a range.
Why You Need the Bolinger M2 Today
Most retail traders struggle with "blind trading"—entering positions when volatility is already exhausted. The Bolinger M2 Indicator removes this guesswork. It defines the boundaries of expected price movement, allowing you to trade with the confidence of knowing where the "statistical walls" of the market are located.
By integrating the Bolinger M2 into your technical analysis toolkit, you can better manage your risk and improve your entry timing. It is a must-have for any trader looking to master the ebb and flow of the global financial markets.
2 Downloads
Last Update:
May 05, 2026 18:27 PM
Published:
Jan 27, 2026 14:59 PM
Category: