Master Market Volatility with the Keltner ATR Band Indicator for MT4
In the fast-paced world of Forex trading, volatility is the engine that drives price movement. Understanding when a market is overextended or beginning a high-momentum breakout is critical for any professional strategy. The Keltner ATR Band indicator is a premier technical tool for MetaTrader 4 (MT4) that combines trend-following moving averages with volatility-based envelopes to provide a clear, structural view of Price Action.
The Science of Volatility Envelopes
Unlike standard Bollinger Bands, which use standard deviation to measure volatility, Keltner Bands utilize the Average True Range (ATR). This distinction is vital because the ATR is a more direct measure of market "noise" and price expansion. The indicator consists of three primary components:
- The Midline: Typically a 20-period Exponential Moving Average (EMA) that serves as the trend's "anchor."
- The Upper Band: Plotted at a specific multiple of the ATR (usually 2.0) above the EMA, representing a zone of bullish overextension.
- The Lower Band: Plotted at the same multiple below the EMA, representing a zone of bearish overextension.
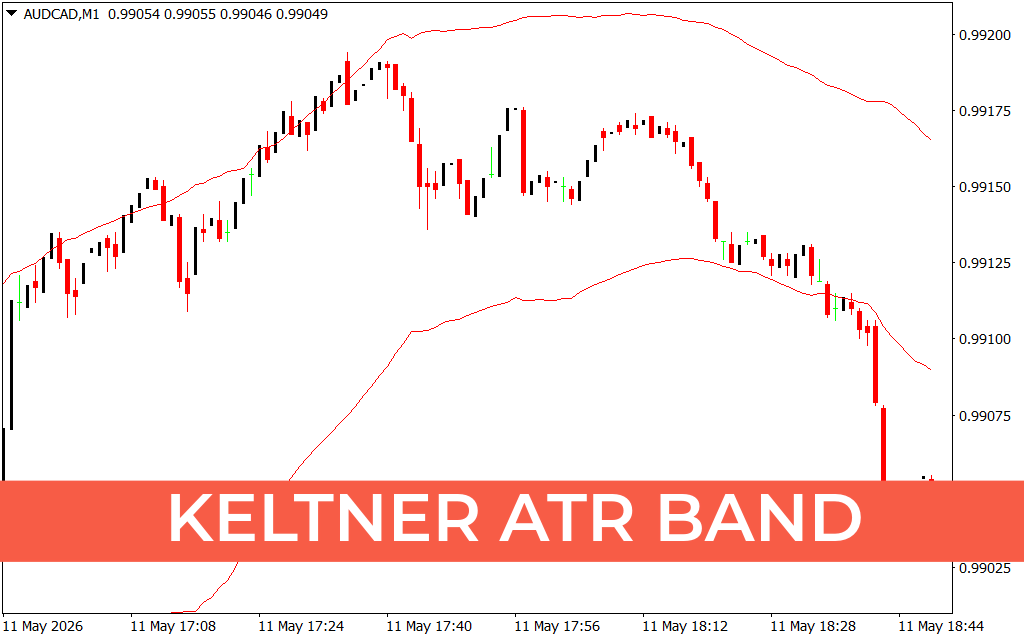
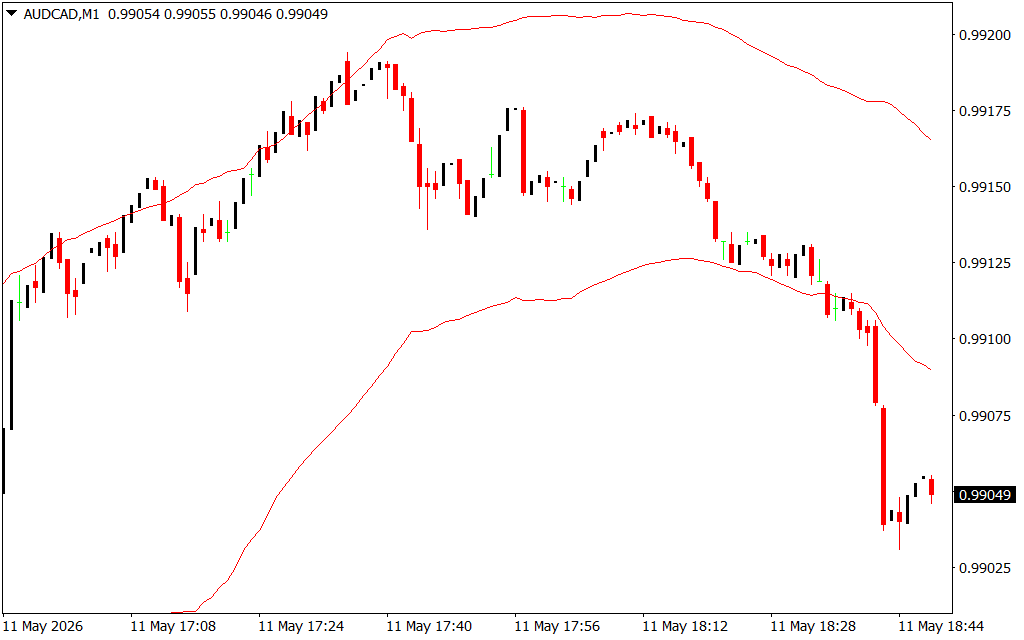
As demonstrated in the AUD/CAD M1 chart, the bands act as a dynamic "container" for price. When price remains within the bands, the market is in a normal state of volatility. However, when price begins to "walk the bands" or break outside of them, it signals a significant shift in market energy.
Precision Trading Signals
The Keltner ATR Band indicator is renowned for its ability to filter out market noise and identify high-probability entry points:
- Volatility Breakouts: A candle closing outside the upper or lower band often signals the start of a new, powerful trend. This is particularly effective when the bands have been "squeezed" together, indicating a period of low volatility.
- Mean Reversion: In a ranging market, the bands act as elastic barriers. When price touches the upper band and shows signs of rejection (like a bearish candlestick pattern), it often gravitates back toward the midline or the opposite band.
- Dynamic Support And Resistance: During a strong trend, the midline (EMA) often acts as a moving support level. Traders can use pullbacks to this line as low-risk entry points to join an existing move.
- Trend Strength Identification: The "slope" of the bands provides instant feedback on trend intensity. Steeply angled bands confirm a healthy trend, while flat bands warn of a choppy, non-directional market.
Why Professional Traders Prefer Keltner ATR Bands
The primary advantage of using ATR-based bands is their responsiveness. Because the ATR accounts for price gaps and volatility spikes more effectively than standard deviation, Keltner Bands provide a smoother and more reliable framework for setting stop-losses and take-profit targets.
Whether you are a scalper looking for quick volatility bursts on the M1 timeframe or a swing trader managing daily positions, the Keltner ATR Band indicator provides the objective, data-driven edge required to navigate today's volatile markets with confidence.
3 Downloads
Last Update:
May 11, 2026 21:50 PM
Published:
Jan 24, 2026 13:14 PM
Category: