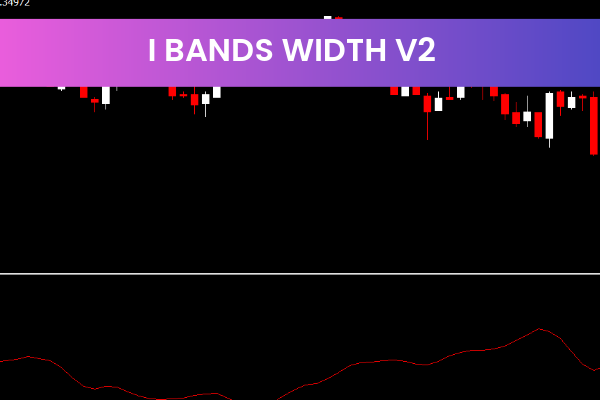
The I Bands Width v2 Indicator for MT4 is a powerful and easy-to-use forex trading tool designed to help traders measure market volatility with precision. Built on the well-known Bollinger Bands concept, this indicator calculates the width between the upper and lower bands and displays the result as a clear histogram. By analyzing changes in band width, traders can better understand whether the market is expanding or contracting, making it easier to plan entries and exits.
This indicator is free to download and works seamlessly on the MetaTrader 4 platform, making it a popular choice among beginner and professional traders alike.
Understanding the I Bands Width v2 Indicator
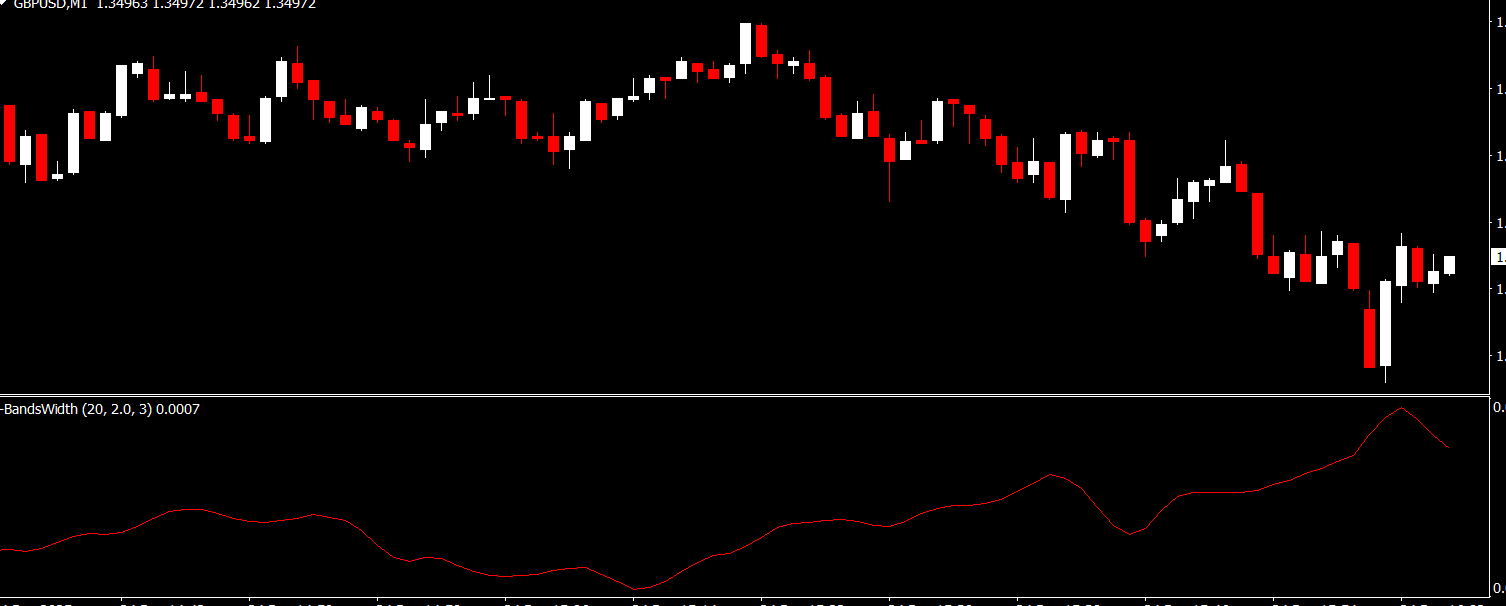
The I Bands Width v2 Indicator for MT4 focuses on one key market behavior: volatility. Bollinger Bands naturally expand when volatility increases and contract during quiet market conditions. This indicator converts that visual behavior into a histogram, allowing traders to quantify volatility instead of relying on guesswork.
The histogram is calculated by subtracting the lower Bollinger Band from the upper Bollinger Band and expressing the result as a percentage of price. This makes it easier to compare volatility levels across different currency pairs and timeframes.
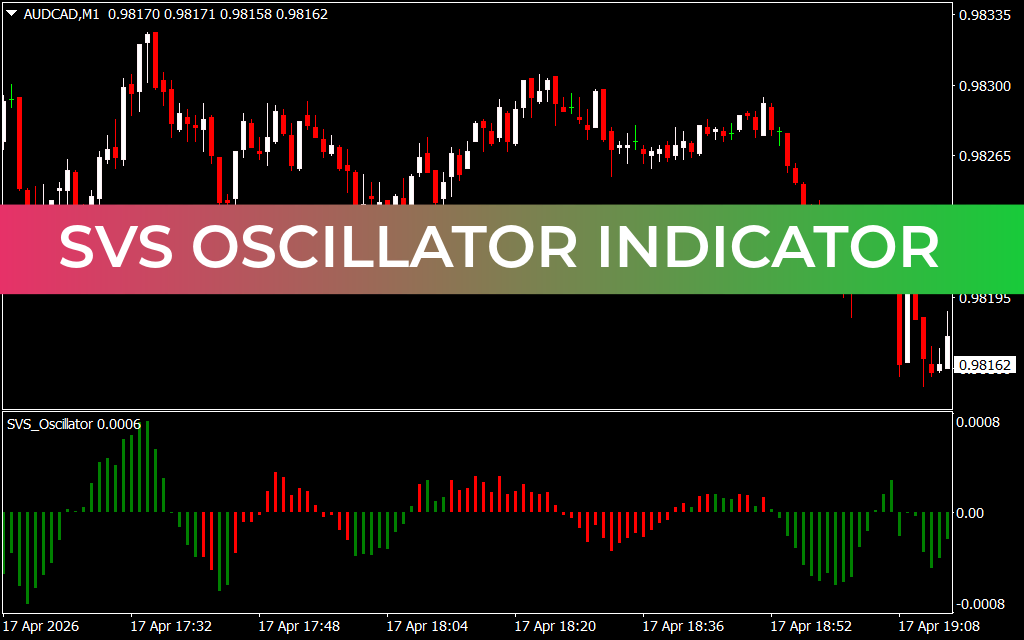
How the Histogram Works
The histogram displayed by the I Bands Width v2 Indicator for MT4 reacts directly to changes in market activity.
Rising Histogram
When the histogram bars are rising, it means the Bollinger Bands are widening. This widening indicates increasing volatility, which often occurs before or during strong price movements. Traders may use this information to look for potential breakout opportunities or confirm momentum-based strategies.
Falling Histogram
When the histogram is falling, the Bollinger Bands are narrowing. This suggests decreasing volatility and a consolidating market. Such conditions often appear before trend reversals or extended ranging phases. Traders commonly interpret this as a signal to tighten stops or prepare for possible exits.
Trading Strategies Using I Bands Width v2
The I Bands Width v2 Indicator for MT4 can be used as a standalone volatility tool or combined with other technical indicators.
Entry Identification
Rising histogram values may indicate the beginning of a volatile phase. Traders often wait for confirmation from Price Action, trend indicators, or momentum oscillators before entering trades during these periods.
Exit and Risk Management
When the histogram begins to decline, it can signal reduced market interest. This is useful for managing open positions, locking in profits, or avoiding low-volatility environments where false signals are more common.
Advantages of Using This Indicator
The I Bands Width v2 Indicator for MT4 offers several key benefits:
Simple and intuitive histogram display
Helps identify volatility expansion and contraction
Suitable for all timeframes
Works with forex, indices, commodities, and cryptocurrencies
Free to download and easy to install
Because volatility is a critical factor in trading success, this indicator serves as a valuable addition to any technical analysis toolkit.
Best Practices for Traders
For best results, traders should avoid using the I Bands Width v2 Indicator for MT4 in isolation. Combining it with trend indicators, Support And Resistance analysis, or price action techniques can significantly improve accuracy. Additionally, testing the indicator on a demo account before live trading is strongly recommended.
Final Thoughts
The I Bands Width v2 Indicator for MT4 is an excellent tool for traders who want to better understand market volatility and improve timing decisions. Its clear histogram visualization, ease of use, and free availability make it suitable for traders of all experience levels.
To explore more free MT4 indicators and professional trading tools, visit IndicatorForest.com and enhance your trading strategy today.
Published:
Dec 24, 2025 20:11 PM
Category: