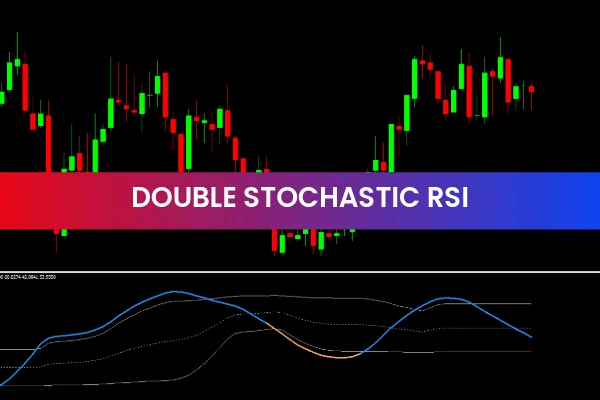
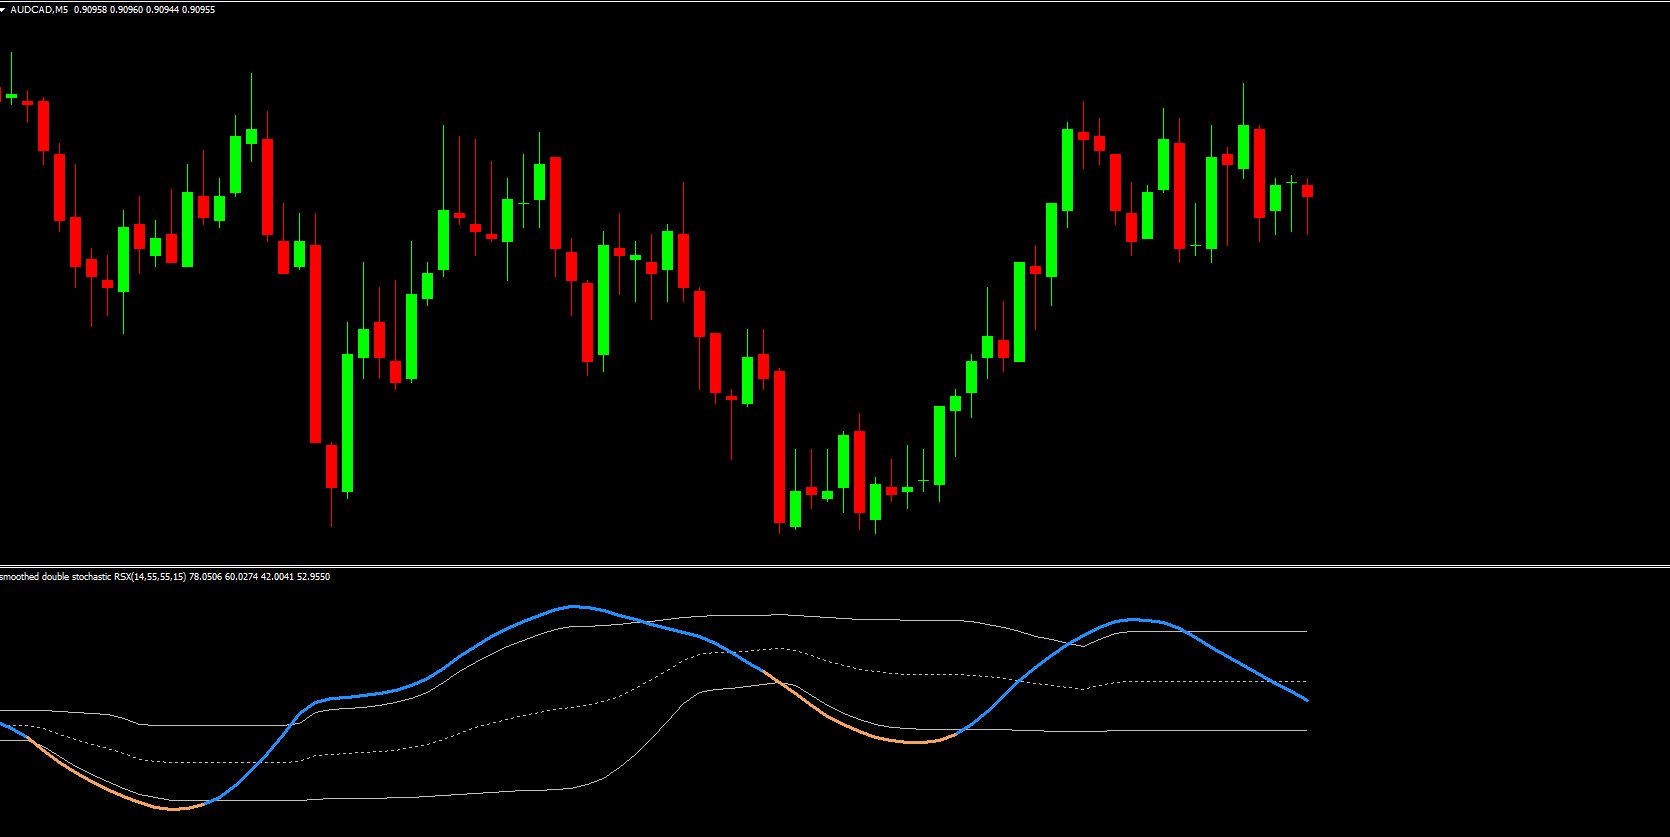
The Double Stochastic RSI Indicator is a popular and free Forex tool for the MetaTrader 4 (MT4) platform. By combining the Stochastic Oscillator and the Relative Strength Index (RSI), this indicator helps traders identify potential buy and sell signals more accurately than using either indicator alone.
This dual-indicator approach makes it a reliable tool for traders seeking to improve their timing for entering and exiting trades, while also understanding the market’s momentum and trend strength.
How the Double Stochastic RSI Indicator Works
The Double Stochastic RSI Indicator works by integrating two widely-used technical indicators:
Stochastic Oscillator: Measures market momentum and identifies overbought or oversold conditions.
Relative Strength Index (RSI): Measures the strength of the current trend and helps identify potential reversals.
By combining these indicators, the Double Stochastic RSI generates more precise signals, reducing the risk of false entries and exits. When the indicator identifies strong momentum in conjunction with Trend Strength, it signals potential buy or sell opportunities.
Key Features of the Double Stochastic RSI Indicator
The Double Stochastic RSI Indicator includes several features that make it a powerful tool for Forex traders:
Combines Stochastic Oscillator and RSI for enhanced accuracy
Identifies overbought and oversold market conditions
Generates reliable buy and sell signals
Works on all MT4 timeframes and currency pairs
Free and easy to install on MT4
Suitable for Scalping, day trading, and swing trading
Helps confirm trend strength and momentum
These features provide traders with a clear view of the market, making it easier to plan entries, exits, and stop-loss levels effectively.
Benefits of Using the Double Stochastic RSI Indicator
The main advantage of the Double Stochastic RSI Indicator is its ability to filter out false signals and provide higher-quality trade setups. By analyzing momentum and trend strength together, traders can:
Identify potential trend reversals with greater accuracy
Confirm overbought or oversold conditions before entering trades
Improve trade timing for both short-term and long-term strategies
Enhance decision-making with a dual-indicator approach
How Traders Can Use the Indicator Effectively
To use the Double Stochastic RSI Indicator effectively:
Enter long positions when both Stochastic and RSI indicate oversold conditions and upward momentum
Enter short positions when both indicators show overbought conditions with downward momentum
Combine with other indicators, such as Support And Resistance or moving averages, to increase trade reliability
Monitor multiple timeframes to confirm trend strength and avoid false signals
By integrating the Double Stochastic RSI into a broader trading strategy, traders can increase the probability of successful trades while managing risk more effectively.
Why the Double Stochastic RSI Indicator Is Popular
The Double Stochastic RSI Indicator is widely used because it enhances the accuracy of traditional momentum and trend indicators. By combining two complementary tools, it provides actionable insights without overcomplicating the chart. Its simplicity and reliability make it a favorite among both beginner and experienced MT4 traders.
Overall, the Double Stochastic RSI Indicator is a powerful MT4 tool for traders seeking to identify buy and sell signals, confirm trend strength, and improve trading performance.
Download the Double Stochastic RSI Indicator today from IndicatorForest.com and enhance your Forex trading toolkit with this free MT4 indicator.
FAQ
It merges the Stochastic Oscillator with RSI to highlight overbought and oversold zones with extra confirmation. Both tools need to agree before a strong buy or sell suggestion appears.
Consider long trades when both components show oversold conditions and turn upward, and short trades when both show overbought conditions and turn downward. Additional confirmation from trend and levels is recommended.
Yes, it functions on any MT4 timeframe, making it suitable for scalpers and swing traders alike. Higher‑timeframe signals tend to be more reliable.
Because it requires alignment between two momentum measures, it ignores situations where only one oscillator briefly spikes. This dual requirement can reduce the number of weak setups.
Trend indicators, chart patterns and support/resistance zones help validate whether an overbought or oversold reading is occurring in a good location for a reversal or continuation.
1 Download
Published:
Dec 18, 2025 01:45 AM
Category: