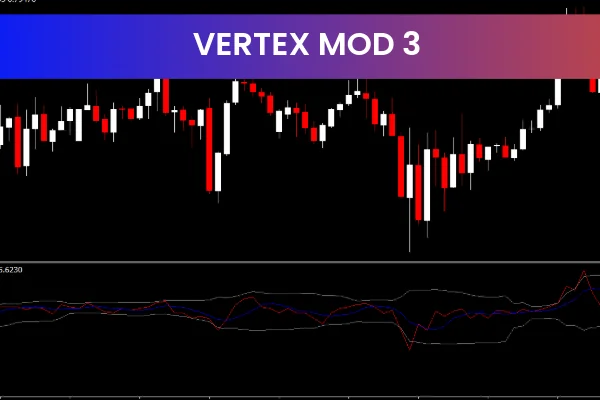
The Vertex Mod 3 Indicator is a popular and free Forex Indicator for the MetaTrader 4 platform, designed to help traders analyze market momentum and trend direction with clarity. This indicator is especially useful for traders who rely on momentum-based strategies to identify potential entry and exit points. By using histogram bars and an oscillator, the Vertex Mod 3 Indicator provides a clear visual representation of whether the market is trending upward or downward.
Thanks to its simple design and intuitive color coding, the Vertex Mod 3 Indicator is suitable for both beginner and experienced Forex traders.
What Is the Vertex Mod 3 Indicator
The Vertex Mod 3 Indicator is a Momentum Indicator that measures the difference between the opening price and the closing price of a currency pair. This difference is then displayed visually on the chart, allowing traders to quickly assess market direction and strength.
The indicator consists of two main components:
A histogram that shows trend direction and momentum
An oscillator that helps identify overbought and oversold conditions
Together, these elements make the indicator a complete tool for momentum and trend-based analysis.
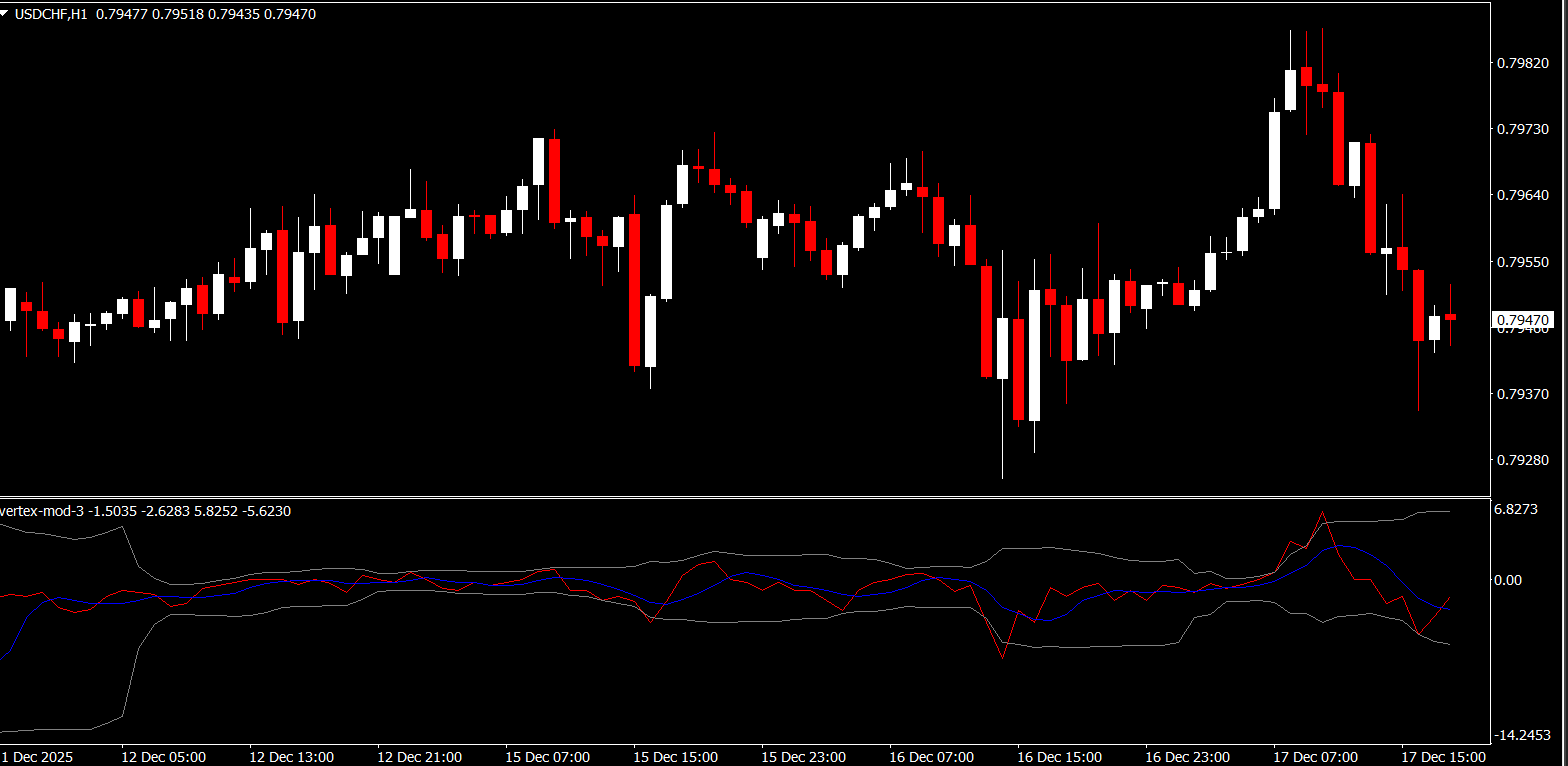
How the Vertex Mod 3 Indicator Works
The Vertex Mod 3 Indicator uses price-based calculations to reflect market momentum in real time.
Histogram Calculation
The histogram is calculated by measuring the difference between the closing price and the opening price of each candle:
Green bars appear when the closing price is higher than the opening price, signaling bullish momentum
Red bars appear when the closing price is lower than the opening price, signaling bearish momentum
This color-based approach allows traders to instantly see whether buyers or sellers are in control.
Oscillator Component
In addition to the histogram, the Vertex Mod 3 Indicator includes an oscillator. The oscillator is also based on the relationship between open and close prices and is plotted in a separate window or combined display.
Green oscillator values indicate bullish pressure
Red oscillator values indicate bearish pressure
This oscillator helps traders identify momentum extremes and potential turning points in the market.
Identifying Market Trends
One of the primary uses of the Vertex Mod 3 Indicator is trend identification.
Consistent green histogram bars indicate a strong upward trend
Consistent red histogram bars indicate a strong downward trend
When the color changes or the histogram weakens, it may suggest slowing momentum or an upcoming trend shift.
Overbought and Oversold Conditions
The oscillator within the Vertex Mod 3 Indicator is particularly useful for spotting overbought and oversold market conditions.
Extreme bullish values may indicate overbought conditions
Extreme bearish values may indicate oversold conditions
These zones can help traders prepare for potential pullbacks or reversals, especially when combined with Support And Resistance levels.
Entry and Exit Signal Strategies
The Vertex Mod 3 Indicator can be effectively used to time trades.
Entry Signals
Buy setups may occur when the histogram turns green and the oscillator confirms bullish momentum
Sell setups may occur when the histogram turns red and the oscillator confirms bearish momentum
Using higher timeframe trend confirmation can improve signal reliability.
Exit Signals
Weakening histogram bars may suggest it is time to exit a trade
Oscillator reversals can indicate momentum exhaustion
These signals help traders protect profits and manage risk more effectively.
Best Timeframes and Market Conditions
The Vertex Mod 3 Indicator works on all timeframes, making it suitable for:
Scalping on lower timeframes
Day trading on intraday charts
Swing trading on higher timeframes
It performs best in trending markets where momentum is clearly defined.
Advantages of the Vertex Mod 3 Indicator
The Vertex Mod 3 Indicator offers several benefits:
Clear momentum visualization with color-coded histogram
Built-in oscillator for overbought and oversold analysis
Easy to understand and beginner-friendly
Useful for trend, momentum, and reversal trading
Free and compatible with MT4
These features make it a reliable tool for traders looking to simplify momentum analysis.
Combining Vertex Mod 3 with Other Indicators
For better results, traders often combine the Vertex Mod 3 Indicator with:
Moving averages to confirm trend direction
Support and resistance levels
Price Action patterns
This combination reduces false signals and increases confidence in trade decisions.
Final Thoughts
The Vertex Mod 3 Indicator is a powerful yet simple MT4 momentum tool that helps traders identify trend direction, market strength, and potential entry and exit points. By combining a color-coded histogram with an oscillator, it delivers clear and actionable insights into Forex market behavior.
If you are looking for a free and effective momentum indicator to improve your trading decisions, the Vertex Mod 3 Indicator is a valuable addition to your trading setup. Visit IndicatorForest.com to explore more free MT4 indicators and enhance your Forex trading strategy today.
FAQ
Vertex Mod 3 uses a color-coded histogram and an oscillator to show the difference between open and close prices, revealing bullish and bearish momentum. Green bars and values signal buying strength; red ones signal selling pressure.
You can consider buying when the histogram turns green and the oscillator confirms rising bullish momentum, and selling when they both turn red. Fading weakening bars or oscillator reversals can also be used for exits.
Green bars appear when the close is above the open, signaling bullish momentum, while red bars appear when the close is below the open, signaling bearish momentum. Sequences of same‑colored bars reflect sustained trends.
Yes. Extreme oscillator readings together with extended histogram runs can warn that momentum is stretched and a pullback or reversal may be near, especially near strong levels.
The oscillator highlights overbought and oversold conditions and momentum shifts. Extreme readings or sharp turns can warn that a current move is tiring and that a pullback or reversal may be near.
It works across all MT4 timeframes. On lower charts it highlights fast intraday swings; on higher charts it focuses on broader momentum shifts.
It can be used from very short intraday charts to higher swing‑trading timeframes. Higher charts generally provide cleaner momentum waves, while lower charts respond faster but are more sensitive to noise.
Trend filters, support/resistance and price-action signals such as breakouts or reversal candles can help validate what the histogram and oscillator are showing before you open a trade.
1 Download
Published:
Dec 17, 2025 12:56 PM
Category: