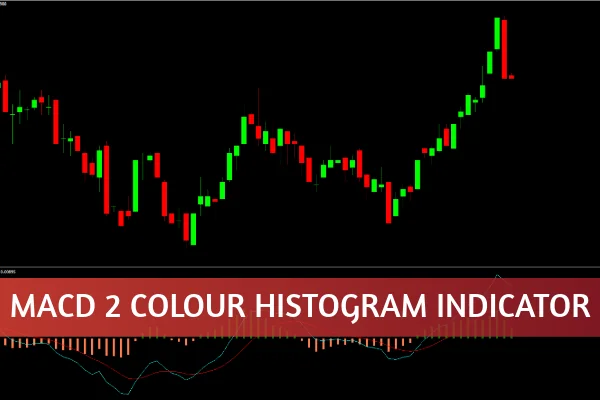
The MACD 2 Color Histogram Indicator for MT4 is an advanced version of the traditional MACD (Moving Average Convergence Divergence) indicator. It provides traders with a two-tone histogram that changes color based on momentum direction. This powerful visual enhancement helps identify bullish and bearish conditions at a glance, allowing for quicker and more confident trading decisions.
Unlike the standard MACD that displays a single-color histogram, this refined indicator offers color-coded signals — typically green for bullish momentum and red for bearish momentum. The result is a clearer view of market strength, helping traders spot potential trend reversals and entry or exit points more effectively.
How the MACD 2 Color Histogram Indicator Works
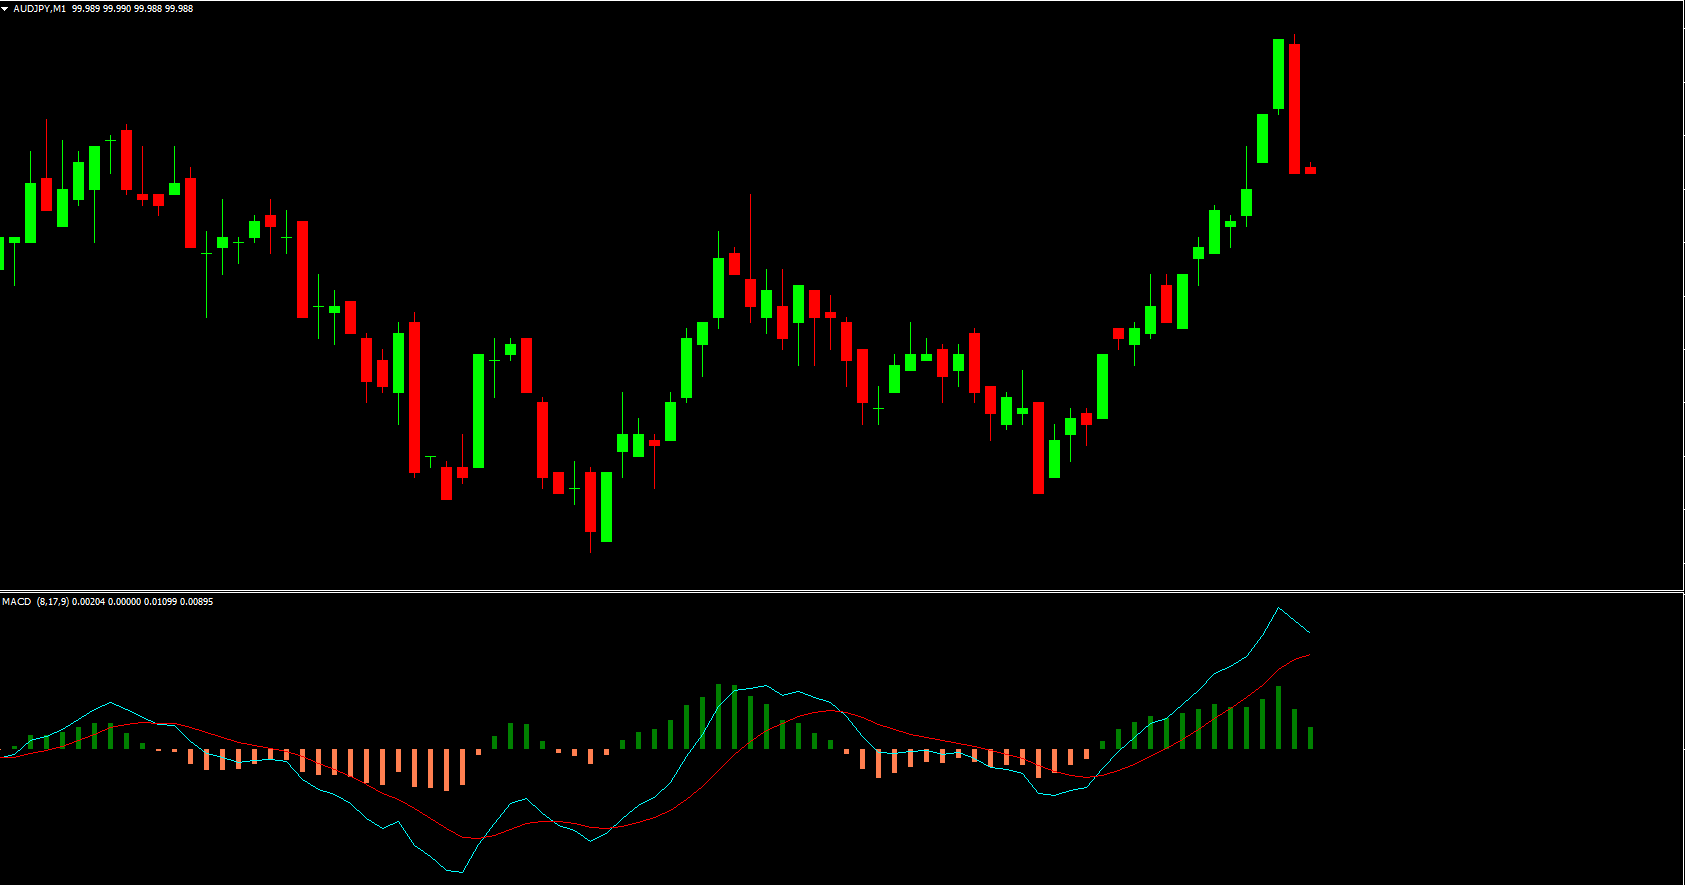
The indicator is built upon the same foundation as the classic MACD, using the relationship between the MACD line, signal line, and zero line to measure market momentum. However, its dual-color histogram adds an extra layer of insight by changing colors when momentum shifts.
MACD 2 Color Histogram Trading Signals
Green Histogram – Bullish Momentum:
When the histogram turns green, it indicates increasing bullish momentum, signaling a potential buy opportunity. This suggests that the MACD line is above the signal line, and market sentiment is strengthening.
Red Histogram – Bearish Momentum:
A red histogram represents rising bearish momentum. It often appears when the MACD line crosses below the signal line, suggesting a sell setup or a potential downtrend.
Shrinking Histogram – Weakening Momentum:
When the histogram bars start to shrink, it reflects decreasing momentum, which could indicate that the current trend is losing strength. This is a valuable signal for anticipating trend reversals or preparing for exit points.
By observing these changes, traders can quickly confirm market direction, align with dominant momentum, and avoid false entries.
Benefits of Using the MACD 2 Color Histogram Indicator
Enhanced Visual Clarity
The color-coded histogram allows traders to identify momentum shifts instantly without analyzing multiple lines. This visual clarity reduces decision-making time.
Better Timing for Entries and Exits
The indicator helps pinpoint precise buy and sell opportunities by confirming momentum direction before placing a trade.
Ideal for All Trading Styles
Whether you’re a scalper, day trader, or swing trader, the MACD 2 Color Histogram Indicator for MT4 adapts seamlessly to different timeframes and strategies.
Reliable Momentum Confirmation
Use the histogram in combination with Price Action or other indicators (like RSI or moving averages) to confirm your trade setups and avoid false signals.
How to Use the MACD 2 Color Histogram Indicator in MT4
Install the Indicator:
Download the indicator file from IndicatorForest.com and place it in your MT4 “Indicators” folder.
Apply It to Your Chart:
Open your MT4 platform, select the indicator from your list, and apply it to any currency pair or asset.
Customize Settings:
Adjust colors, line thickness, and parameters to match your preferred trading style.
Interpret the Colors:
Green Bars: Consider looking for buy opportunities.
Red Bars: Prepare for sell trades or downtrends.
Shrinking Bars: Watch for reversals or exits.
Why Traders Choose the MACD 2 Color Histogram
The MACD 2 Color Histogram Indicator for MT4 provides a simple yet powerful upgrade to one of the most trusted momentum tools in technical analysis. By visually distinguishing bullish and bearish momentum, it eliminates confusion and enhances confidence in trading decisions.
This indicator is a must-have for anyone serious about improving their momentum analysis and trade timing.
Conclusion
The MACD 2 Color Histogram Indicator for MT4 transforms the way traders read market momentum. Its dual-color system makes it easy to spot bullish and bearish shifts instantly, giving traders a strategic edge. Whether you’re refining entries, confirming exits, or managing risk, this tool provides reliable insights for smarter trading.
👉 Download the MACD 2 Color Histogram Indicator today from IndicatorForest.com and elevate your trading performance with precise momentum analysis.
3 Downloads
Published:
Oct 27, 2025 00:52 AM
Category: