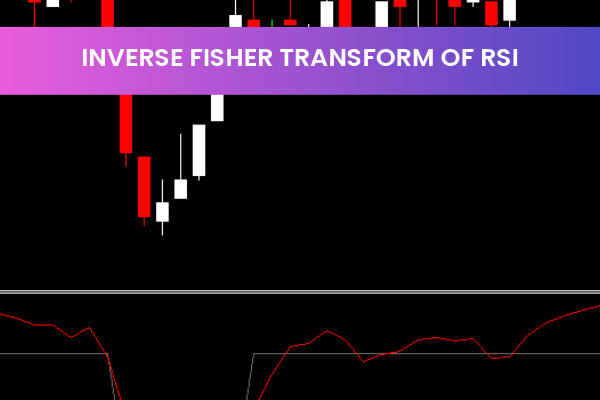
The Inverse Fisher Transform of RSI Forex Indicator is a popular and free tool for the MetaTrader 4 platform. Combining the Relative Strength Index (RSI) with the Fisher Transform, this indicator is designed to help traders identify potential trend reversals and assess market conditions. Its ease of use and flexibility make it suitable for both novice and experienced traders.
By normalizing RSI values using the Fisher Transform, traders can quickly spot overbought or oversold conditions, confirm trend strength, and identify optimal entry and exit points.
What Is the Inverse Fisher Transform of RSI Indicator
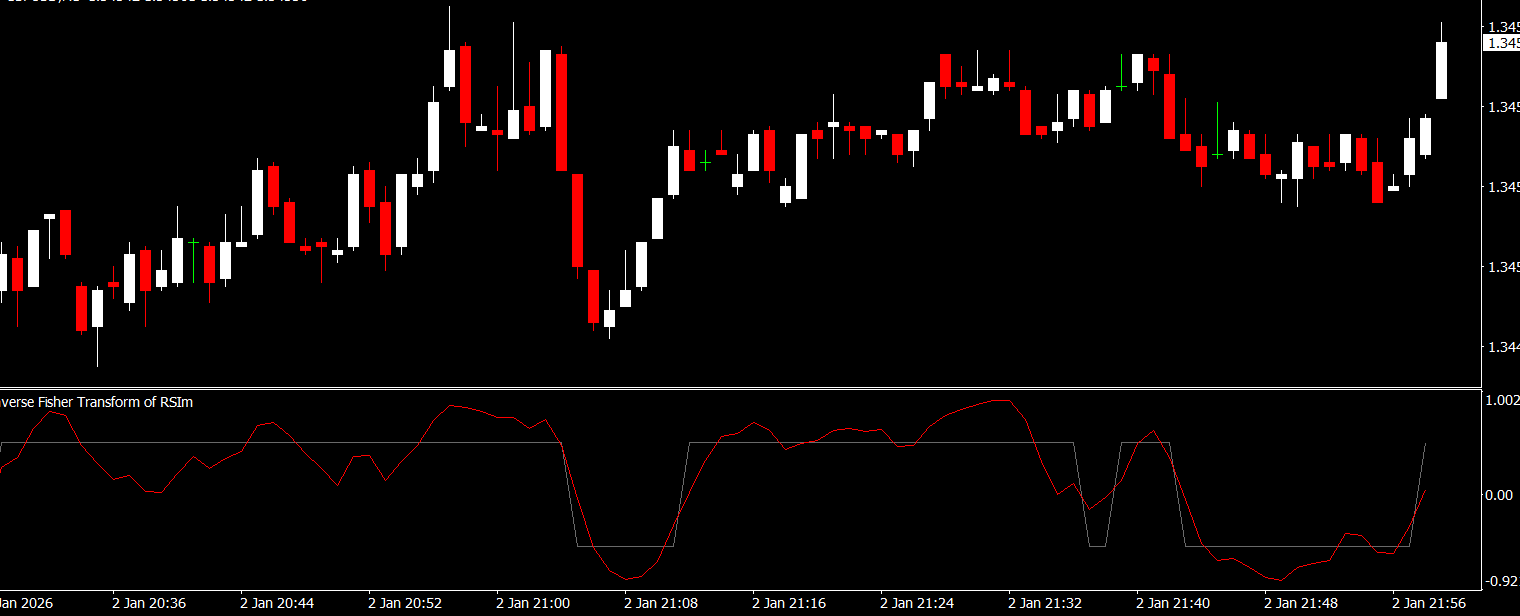
The Inverse Fisher Transform of RSI applies a Fisher Transform to standard RSI values. The transformation converts RSI into a more sensitive and normalized oscillator, ranging between -1 and 1. This normalization allows traders to detect trend reversals and momentum shifts more clearly than using RSI alone.
Key features include:
Bullish Signals – When the indicator rises above 0
Bearish Signals – When the indicator falls below 0
Signal Line – Confirms potential reversals and trend changes
How the Indicator Works
The indicator calculates the Fisher Transform of RSI by taking the natural logarithm of the ratio between the RSI and its exponential moving average. This value is then normalized between -1 and 1, producing smooth and responsive signals.
Traders can use the indicator to:
Identify trend reversals before they fully develop
Confirm Trend Strength alongside other technical tools
Spot overbought or oversold conditions
Determine potential entry and exit points for trades
Identifying Trend Reversals
One of the main advantages of the Inverse Fisher Transform of RSI is its ability to detect early trend reversals. The combination of RSI and Fisher Transform provides sharper signals, reducing lag compared to traditional RSI.
A bullish reversal is indicated when the indicator crosses above the signal line
A bearish reversal occurs when it crosses below the signal line
By using these signals, traders can better time entries and exits, improving trade performance and risk management.
Spotting Overbought and Oversold Conditions
The normalized range of the indicator (-1 to 1) helps traders identify extreme market conditions:
Values near +1 suggest overbought conditions and a potential bearish reversal
Values near -1 suggest oversold conditions and a potential bullish reversal
This makes it easier to identify trade setups and avoid entering positions at the wrong time.
Ease of Use and Free for MT4
The Inverse Fisher Transform of RSI is beginner-friendly and free to use on MT4. Once attached to a chart, it automatically calculates and displays the normalized RSI values and signal line. Its clear visual signals allow traders to make quick and confident trading decisions.
Combining with Other Indicators
Many traders combine the Inverse Fisher Transform of RSI with moving averages, support/resistance levels, or trend indicators to improve signal accuracy. This combination provides confirmation of trades, reducing the likelihood of false entries or exits.
Why Traders Choose the Inverse Fisher Transform of RSI
Traders rely on this indicator for its accuracy, sensitivity, and simplicity. By combining RSI with the Fisher Transform, it provides early reversal signals, confirms trend strength, and identifies overbought or oversold conditions, making it a must-have tool for MT4 Forex traders.
Download this free indicator today at IndicatorForest.com to enhance your trading strategy and improve your Forex performance.
1 Download
Published:
Jan 03, 2026 11:42 AM
Category: