Master Momentum Reversals with Adaptive Stochastic RSI Arrows
In the world of technical analysis, momentum is king. However, traditional momentum oscillators often fall short in trending markets by remaining in overbought or oversold zones for too long. The Adaptive Stochastic RSI Arrows indicator is a next-generation trading tool designed to solve this problem. By combining the sensitivity of the Relative Strength Index (RSI) with the speed of Stochastic analysis, this indicator provides traders with high-precision entry and exit signals.
The Science of Adaptive Momentum
The Stochastic RSI is essentially an "indicator of an indicator." It applies the Stochastic formula to RSI values rather than raw price, which makes it far more sensitive to subtle shifts in momentum. The "Adaptive" component refers to the indicator's ability to adjust its calculations based on current market volatility, ensuring it remains relevant whether the market is ranging or trending strongly.
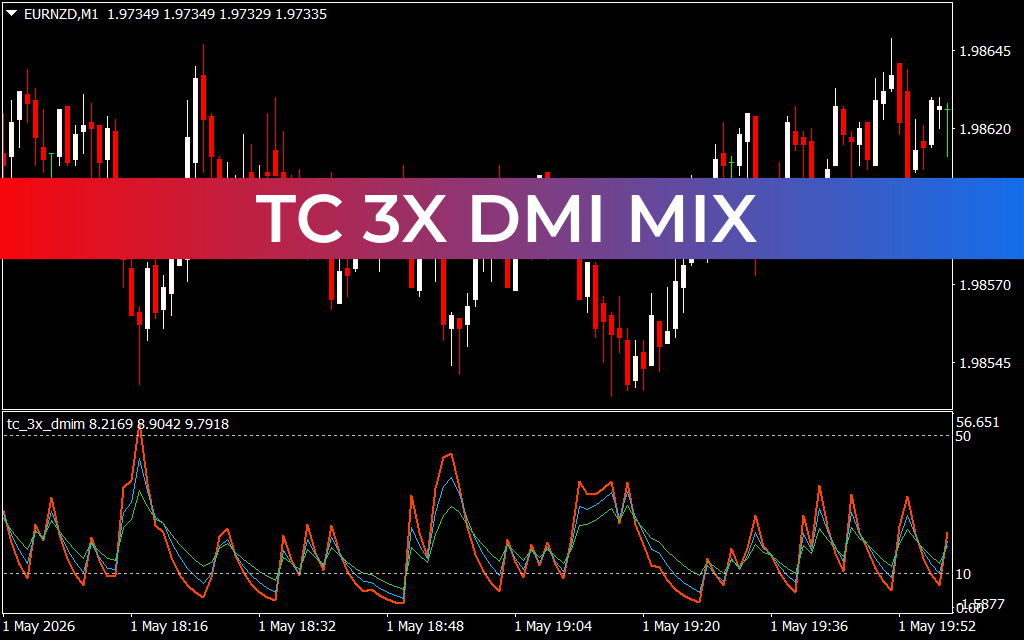
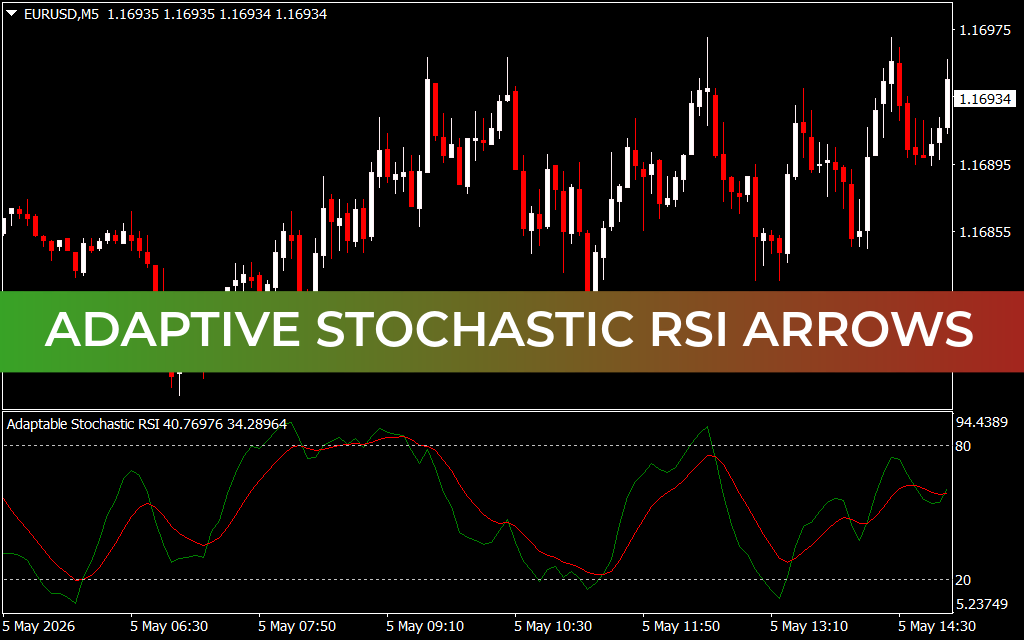
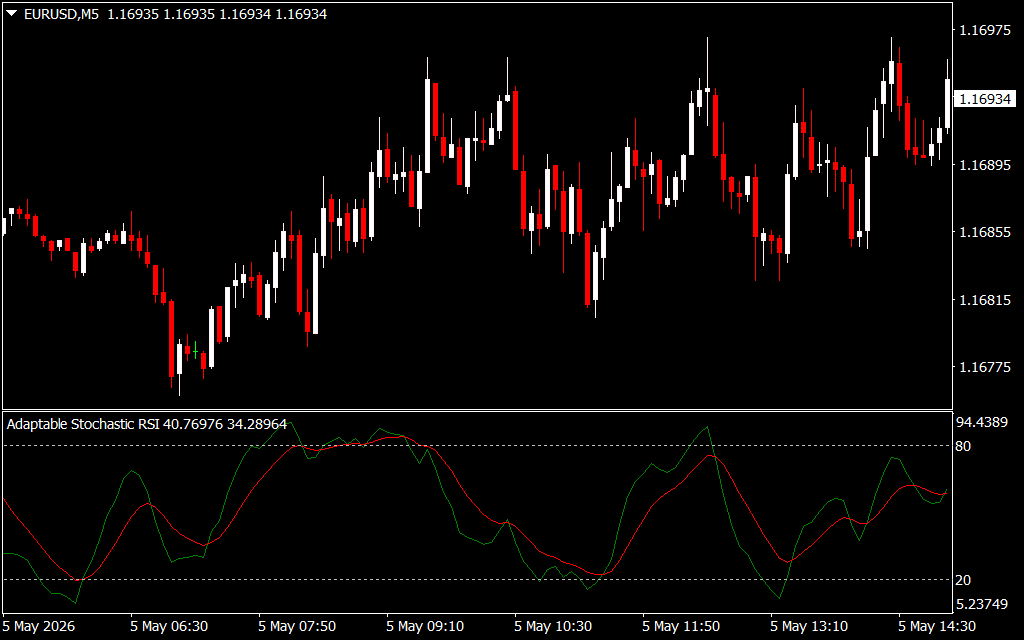
As seen in the file Adaptive Stochastic RSI Arrows.png, the indicator consists of two dynamic lines (typically green and red) that oscillate between defined levels, such as 20 and 80. These levels represent the extremes of market sentiment.
Key Features and Benefits
- Dual-Layer Sensitivity: By combining RSI and Stochastic logic, the indicator identifies momentum shifts that standard oscillators often miss.
- Visual Signal Arrows: The indicator plots clear visual arrows on the chart when momentum flips, removing the need for manual interpretation of complex oscillator crossovers.
- Overbought/Oversold Identification: Clear horizontal boundaries at 80 and 20 help traders identify when a pair is overextended and primed for a reversal.
- Reduced Market Lag: The adaptive nature of the formula allows the indicator to react faster to price changes than traditional simple moving averages.
Trading Strategy: How to Use the Signals
The most powerful way to trade with Adaptive Stochastic RSI Arrows is to look for crossovers at the extremes. For a Buy Signal, wait for the green line to cross above the red line while both are below the 20 level. This indicates that the bearish momentum is exhausted and a bullish recovery is starting.
Conversely, a Sell Signal is generated when the green line crosses below the red line above the 80 level. This signals that the bullish run has reached a peak and a downward correction is likely. For even higher accuracy, many traders use these arrows to enter trades only in the direction of the long-term trend, such as entering "Buy" signals only when price is above a 200-period moving average.
Conclusion
The Adaptive Stochastic RSI Arrows indicator is a must-have for traders who want to capitalize on short-term momentum shifts with professional accuracy. By smoothing out market noise while maintaining extreme sensitivity, it provides the clarity needed to make confident trading decisions. Whether you are Scalping the M5 timeframe or swing trading the daily charts, this indicator provides a reliable roadmap of market momentum.
3 Downloads
Last Update:
May 06, 2026 01:52 AM
Published:
Jan 27, 2026 02:44 AM
Category: