Master Volatility with the Bollinger Bands Color Indicator
In the world of technical analysis, Bollinger Bands are legendary for their ability to measure market volatility and identify overbought or oversold conditions. However, standard bands can sometimes be difficult to interpret during rapid price shifts. The Bollinger Bands Color Indicator takes this classic tool to the next level by adding dynamic color-coding, allowing traders to visualize Trend Strength and volatility changes instantly on their charts.
What is the Bollinger Bands Color Indicator?
The Bollinger Bands Color indicator is a visual enhancement of the traditional tool developed by John Bollinger. While it maintains the core structure—a middle Moving Average with upper and lower standard deviation bands—it introduces a color-filled "cloud" or shifting line colors. This aesthetic and functional upgrade helps traders distinguish between a trending market and a ranging one without having to squint at narrow price channels.
Key Features and Trading Advantages
This indicator is designed for clarity and speed, offering several benefits for MetaTrader users:
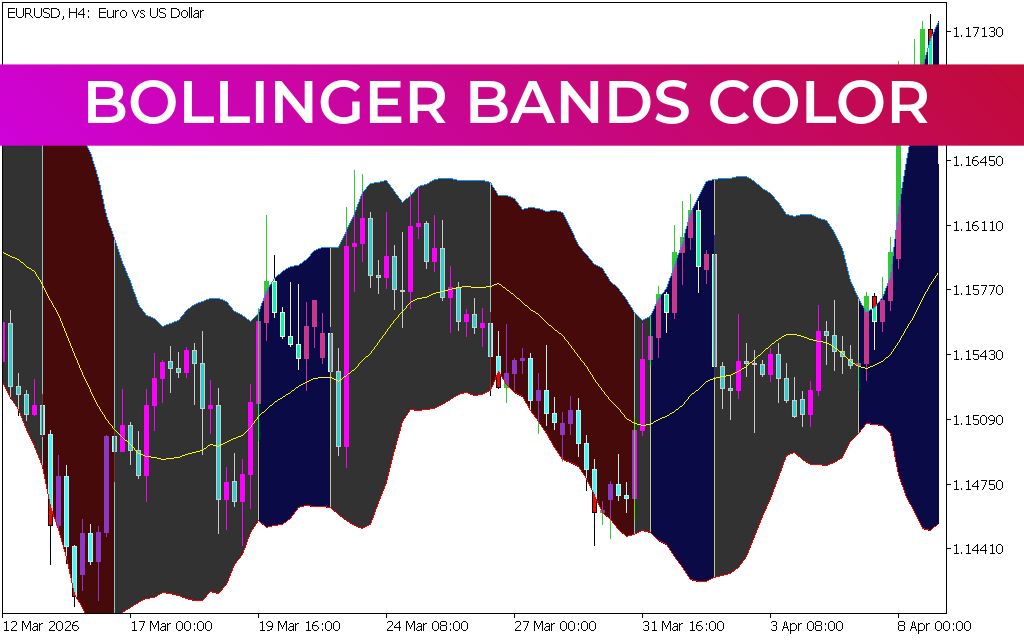
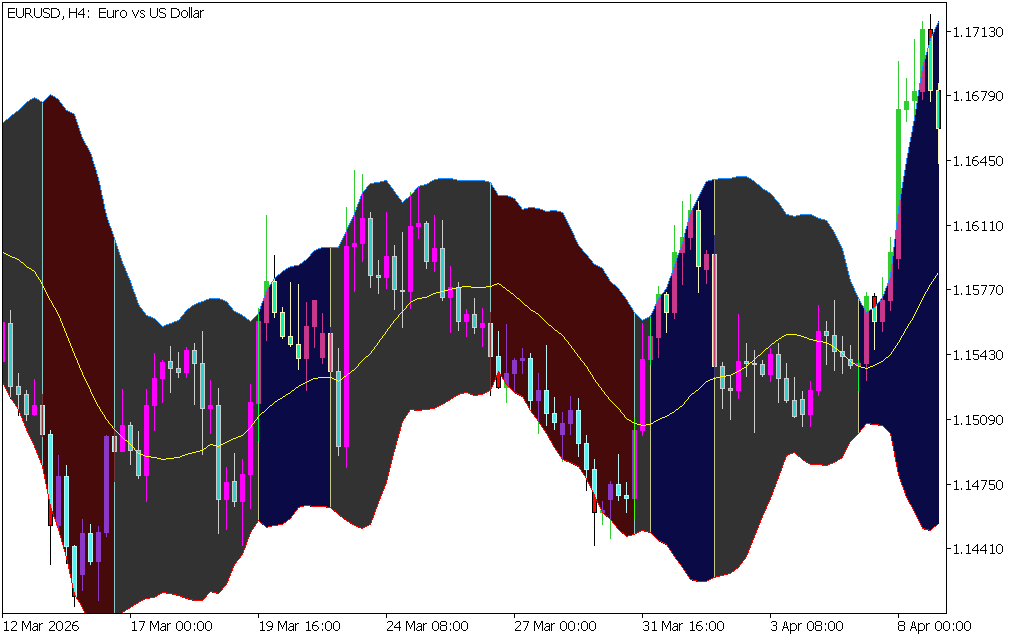
- Dynamic Trend Visualization: The area between the bands often changes color based on price position relative to the median. For example, a blue or green shade may represent bullish momentum, while a red or dark maroon shade indicates a bearish environment.
- Volatility Squeeze Detection: When the bands contract and the color-coded area narrows, it signals a "squeeze." This is a precursor to a major price breakout, and the color shift helps traders prepare for the ensuing volatility expansion.
- Immediate Overbought/Oversold Cues: Price piercing the upper or lower bands is a classic signal. With the color-fill enabled, these extremes become much more apparent, highlighting potential exhaustion points where a reversal is likely.
- Customizable Aesthetics: Traders can tailor the colors to match their background or specific strategy, ensuring that the most important data points stand out during intense trading sessions.
How to Trade with Bollinger Bands Color
Using this indicator effectively involves watching the interaction between price and the colored zones. As seen in the EURUSD H4 chart, when the price "hugs" the outer bands during a specific color phase, it confirms a strong trend.
- Bullish Continuation: Look for the price to remain in the upper half of the colored cloud. If the cloud is blue and the price is riding the upper band, the trend is robust.
- Bearish Reversal: If the price fails to reach the upper band and the cloud color shifts toward a bearish tone (like the dark red seen in the example), it may be time to look for short opportunities or exit long positions.
- Mean Reversion: Many traders use the middle yellow line as a target. When price reaches a band extreme and the color intensity peaks, a move back toward the median line is often the highest-probability trade.
Conclusion
The Bollinger Bands Color indicator is an essential tool for any trader who wants to "see" volatility rather than just calculate it. By providing a clear, color-coded map of Price Action, it reduces cognitive load and helps you make faster, more confident trading decisions. Whether you are a trend follower or a mean-reversion specialist, this indicator brings a new level of professional polish to your MT4 or MT5 platform.
6 Downloads
Last Update:
May 09, 2026 12:01 PM
Published:
Jan 25, 2026 12:34 PM
Category: