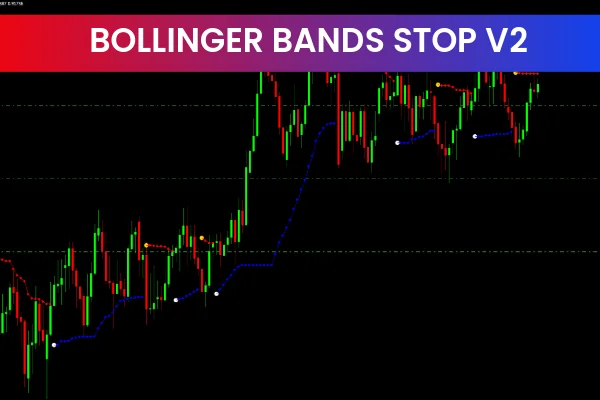
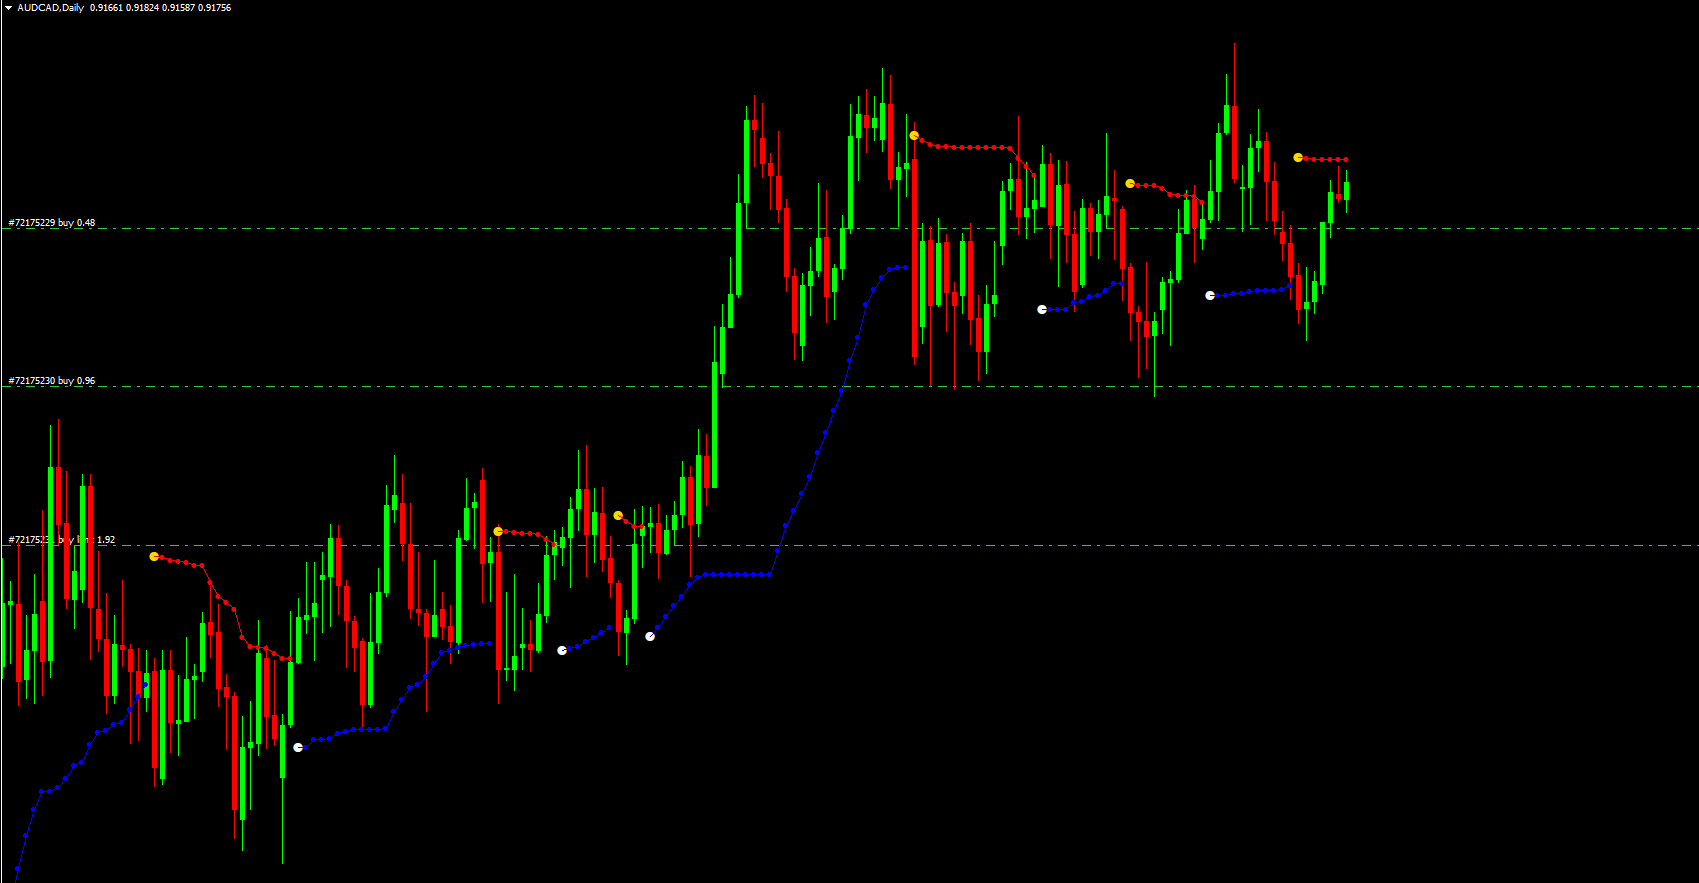
The Bollinger Bands Stop v2 Indicator is a popular and free Forex Indicator for the MT4 platform. It is designed to help traders identify potential entry and exit points, detect market trends, and spot reversals and breakouts. By combining Bollinger Bands with the Relative Strength Index (RSI), this indicator provides a clear view of both market volatility and momentum, helping traders make informed trading decisions.
With its intuitive signals, the Bollinger Bands Stop v2 Indicator is suitable for beginners and experienced traders looking to improve their market analysis.
How the Bollinger Bands Stop v2 Indicator Works
The indicator combines two key elements:
Bollinger Bands: Measures market volatility and plots an upper and lower band around the price
RSI (Relative Strength Index): Measures market momentum to identify overbought or oversold conditions
The buy and sell signals are generated as follows:
Buy Signal: Price is above the upper Bollinger Band and the RSI is below the lower threshold
Sell Signal: Price is below the lower Bollinger Band and the RSI is above the upper threshold
This combination helps traders identify high-probability trading opportunities in trending and volatile markets.
Key Features of the Bollinger Bands Stop v2 Indicator
Trend and reversal identification
Breakout detection
Buy and sell entry signals
Combination of Bollinger Bands and RSI for enhanced accuracy
Works on all MT4-compatible currency pairs and timeframes
Free to use with easy installation and setup
Benefits of Using the Bollinger Bands Stop v2 Indicator
Traders benefit from this indicator in several ways:
Trend Detection: Easily spot upward or downward market trends
Reversal Identification: Recognize potential reversal points before the market moves against your position
Breakout Signals: Detect breakout opportunities when price moves beyond Bollinger Bands
Clear Buy/Sell Signals: Simplifies trading decisions with visual alerts
Beginner-Friendly: Easy to interpret and implement in any trading strategy
Trading Strategies Using the Bollinger Bands Stop v2 Indicator
Trend-Following Strategy
Enter buy trades when price stays above the upper Bollinger Band with strong RSI support
Enter sell trades when price stays below the lower Bollinger Band and RSI indicates overbought conditions
Exit trades when momentum starts to weaken or price crosses the middle Bollinger Band
Breakout Strategy
Enter trades when price breaks above the upper band for bullish continuation
Enter trades when price breaks below the lower band for bearish continuation
Confirm breakout with RSI to reduce false signals
Best Timeframes for the Indicator
The Bollinger Bands Stop v2 Indicator works effectively on multiple timeframes:
M5 & M15: Scalping opportunities
M30 & H1: Intraday trading
H4 & D1: Swing trading and trend confirmation
Higher timeframes produce more reliable signals, while lower timeframes offer faster trade opportunities.
Combining the Indicator with Other Tools
To enhance accuracy, traders often combine the Bollinger Bands Stop v2 Indicator with:
Moving Averages
Trend lines and support/resistance levels
Stochastic Oscillator or MACD
Price Action strategies
Ease of Use
This indicator is simple to install and use on the MT4 platform. Its visual design clearly highlights entry, exit, trend, and reversal points, making it suitable for traders at all levels.
Final Thoughts
The Bollinger Bands Stop v2 Indicator for MT4 is a versatile and powerful tool for Forex traders. By combining Bollinger Bands and RSI, it helps identify trends, reversals, and breakouts with high accuracy. Whether you are a beginner or an experienced trader, this indicator can improve your trading strategy and decision-making process.
👉 Visit IndicatorForest.com to download this indicator for free and explore more advanced MT4 tools and trading strategies.
1 Download
Published:
Dec 28, 2025 20:15 PM
Category: