Mastering Pure Price Action with the Point & Figure Chart Indicator for MT4
In a world of high-frequency trading and cluttered technical indicators, many professional traders are returning to the roots of market analysis to find a definitive edge. The Point & Figure (P&F) Chart Indicator for MetaTrader 4 (MT4) is a specialized tool that strips away the "noise" of time and volume, focusing exclusively on significant price movements. Developed in the late 19th century, this timeless methodology remains one of the most effective ways to identify institutional-grade Supply And Demand imbalances, providing traders with a crystal-clear map of the market's true direction.
The Power of Time-Independent Analysis
Unlike standard candlestick or bar charts that plot price against fixed time intervals (such as M15 or H1), a Point & Figure chart only records a new entry when price moves by a specific amount, known as the Box Size. This unique approach creates a "filtered" view of the market where minor fluctuations are ignored.
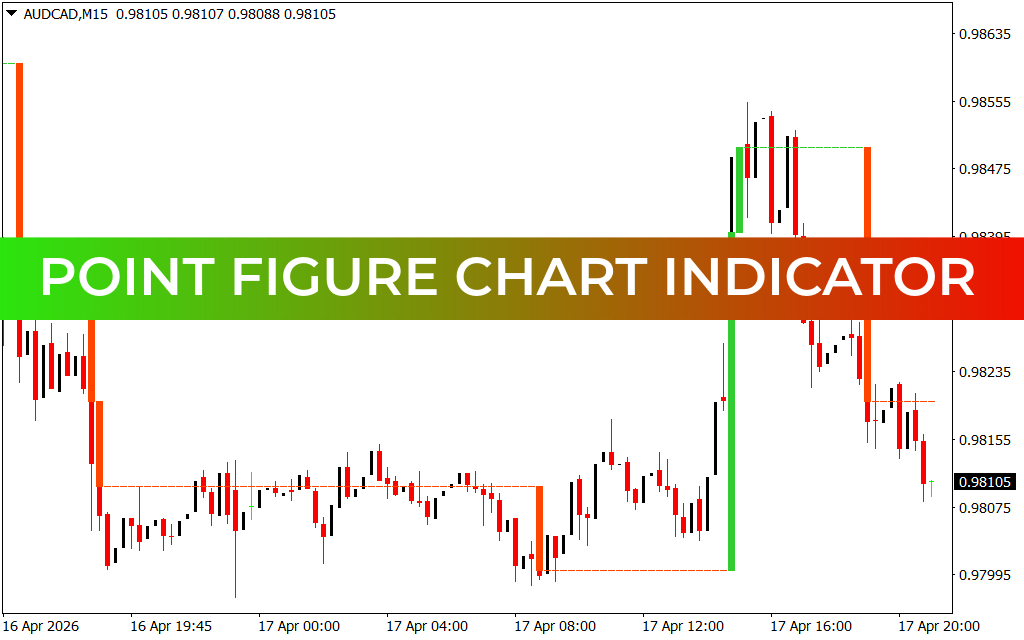
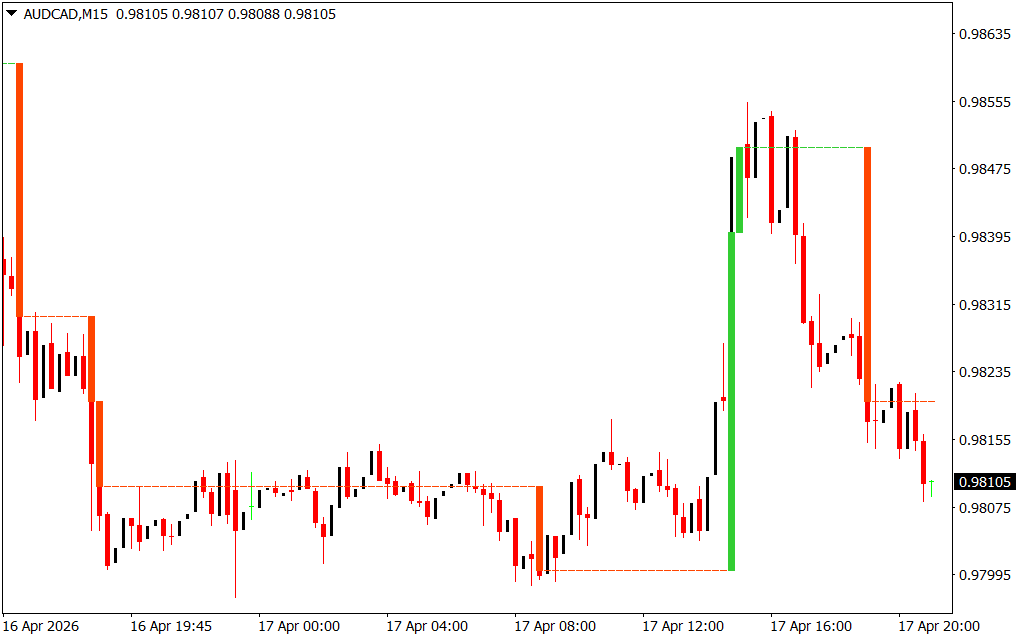
As demonstrated in technical analysis across pairs like AUD/CAD on the M5 timeframe, the P&F Indicator provides several strategic advantages:
- Objective Trend Identification: P&F charts utilize columns of "X's" to represent rising prices and "O's" to represent falling prices. A new column is only started after a "Reversal" threshold is met. This makes trend identification entirely objective; as seen on recent structural charts, you are either in a column of demand (X) or a column of supply (O), leaving no room for emotional bias.
- Automatic Support And Resistance: P&F logic naturally highlights horizontal congestion zones. When columns of X's and O's cluster together, they form highly accurate support and resistance levels. These "bases" act as powerful launchpads for breakouts, which are easily identified when a new column of X's exceeds the height of the previous bullish column.
- Noise Reduction in Volatile Markets: On lower timeframes like the M1 or M5, time-based charts can look chaotic due to news spikes. The P&F Indicator filters these out, only updating when a meaningful price shift occurs. This allows scalpers to focus on the structural "meat" of the move rather than the distraction of minor price wiggles.
- Clear Target Calculation: One of the most legendary features of P&F charting is the "Horizontal Count." By measuring the width of a congestion zone, traders can mathematically project the potential distance of the ensuing breakout, providing a data-driven approach to profit targets.
Strategic Implementation for the Systematic Trader
The Point & Figure Chart Indicator is an essential asset for any trader who values structural integrity and precision.
- Breakout Confirmation: Use the P&F Indicator to validate breakouts seen on your standard candle charts. If a candle breaks resistance but the P&F chart hasn't printed a new high in a column of X's, the move may lack the institutional backing required for a sustained trend.
- Trailing Stop Management: P&F reversal points provide the most logical locations for stop-losses. By trailing your stop at the bottom of the most recent "O" column in an uptrend, you ensure that you only exit when the trend has truly shifted.
- Cross-Verification: Align your P&F analysis with volatility gauges like the ADX or Bollinger Bandwidth Ratio. When a P&F breakout coincides with a surge in volatility, the probability of a high-velocity move increases exponentially.
Conclusion
The Point & Figure Chart Indicator for MT4 is a definitive solution for traders who demand structural clarity. By bridging the gap between classic technical theory and modern digital execution, it empowers you to navigate the financial markets with professional-grade confidence. Elevate your technical analysis today and discover the purity of price action with the Point & Figure system.
SEO Meta Description
Download Point Figure Chart for free. Professional MT4 price action tool that filters market noise to identify institutional support and resistance.
2 Downloads
Last Update:
Apr 18, 2026 00:03 AM
Published:
Feb 08, 2026 10:26 AM
Category: