The MTF MARSI Indicator is a popular and free Forex trading tool designed for the MetaTrader 4 (MT4) platform. This indicator is especially valuable for traders who rely on multi-time frame analysis to improve accuracy. By combining the Moving Average (MA) and the Relative Strength Index (RSI) into a single visual tool, the MTF MARSI Indicator helps traders quickly identify trend direction, Trend Strength, and potential entry and exit points across multiple time frames.
Multi-time frame indicators are essential in Forex trading because trends often differ depending on the selected timeframe. The MTF MARSI Indicator simplifies this process by presenting clear visual signals that reflect both momentum and direction in one place.
How the MTF MARSI Indicator Works
The MTF MARSI Indicator integrates two widely used technical analysis tools:
Moving Average – identifies the overall trend direction
Relative Strength Index (RSI) – measures the strength or weakness of the trend
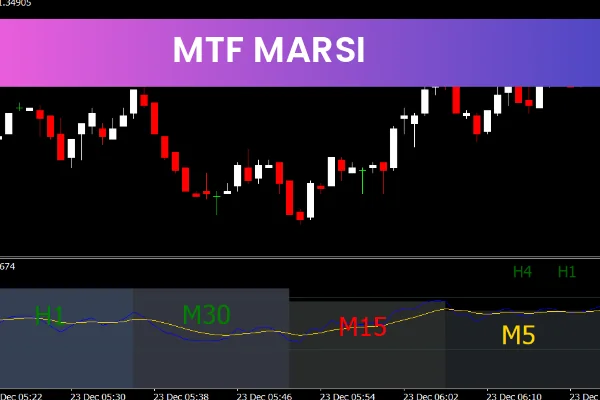
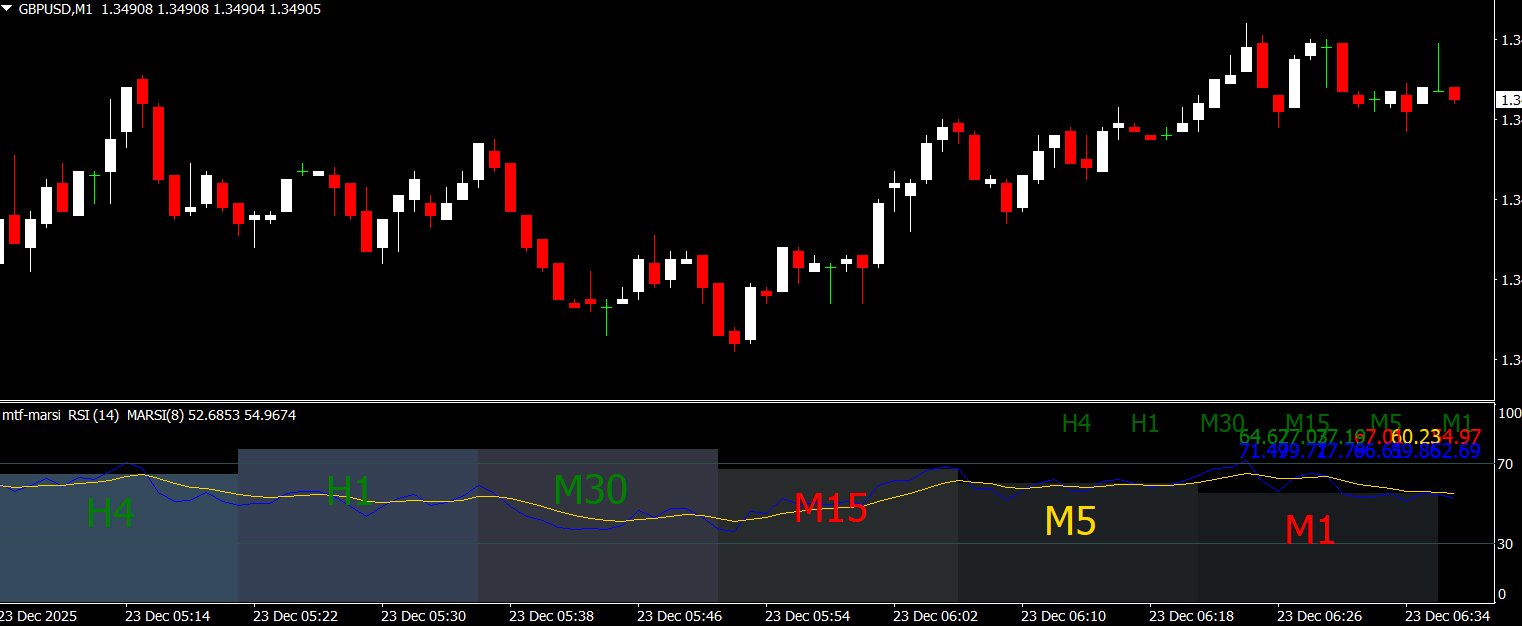
The indicator plots two main lines on the chart. One line represents the RSI, while the other represents the moving average trend. These lines move in opposite directions, making it easy to interpret market conditions.
When the RSI line moves strongly away from the moving average, it signals strong momentum. When the RSI line weakens or converges toward the moving average, it may indicate trend exhaustion or a possible reversal.
Multi Time Frame Trend Analysis
One of the strongest features of the MTF MARSI Indicator is its ability to display trend direction across multiple time frames simultaneously. This allows traders to:
Confirm higher-time-frame trends
Avoid trading against dominant market direction
Improve timing on lower-time-frame entries
For example, a trader may identify a strong bullish trend on a higher timeframe and then use the MTF MARSI Indicator to find precise entry points on a lower timeframe.
Identifying Trend Strength and Reversals
Trend Strength Confirmation
When the RSI line shows strong movement in alignment with the moving average direction, it confirms trend strength. This helps traders stay in winning trades longer.
Trend Reversal Signals
If the RSI line weakens or crosses against the moving average direction, it may signal a potential trend reversal or market consolidation. Traders can use this information to prepare for exits or trend changes.
Why Forex Traders Use the MTF MARSI Indicator
Combines MA and RSI into one indicator
Supports multi-time frame analysis
Easy to read and interpret signal
Helps confirm trend direction and momentum
Free and compatible with all MT4 charts
The indicator is suitable for Scalping, day trading, and swing trading strategies, making it versatile for different trading styles.
Combining MTF MARSI with Other Indicators
For better accuracy, traders often combine the MTF MARSI Indicator with other tools such as the Dual Time Frame MACD, HLCrossSig Indicator, or Quasi Volume Bars Indicator. This combination allows traders to confirm trend direction, momentum, and volume before entering a trade.
Ease of Use and Customization
The MTF MARSI Indicator is easy to install and apply to any MT4 chart. Traders can customize settings such as time frames, moving average periods, and RSI parameters to match their individual trading strategy and preferences.
Final Thoughts
The MTF MARSI Indicator is an excellent MT4 tool for Forex traders who want a clear and efficient way to analyze trends across multiple time frames. By combining moving averages with RSI, it provides valuable insights into both direction and strength, helping traders make more confident trading decisions.
👉 Visit IndicatorForest.com to download the MTF MARSI Indicator and explore more free MT4 Forex indicators to improve your trading performance.
FAQ
Published:
Dec 23, 2025 00:40 AM
Category: