Mastering Market Reversals with the Bounce Strength Index V2.0
In the high-velocity world of Forex trading, the ability to predict where price will "bounce" is one of the most profitable skills a trader can possess. Markets rarely move in a straight line; instead, they breathe in a series of expansions and retracements. The Bounce Strength Index (BSI) v2.0 is a sophisticated technical indicator engineered to quantify the hidden force behind these market pivots, allowing traders to enter at the very beginning of a new momentum wave.
What is the Bounce Strength Index?
The Bounce Strength Index is a volume-weighted momentum oscillator that measures the intensity of price rejections at key structural levels. Unlike standard oscillators that only track price movement, the BSI v2.0 integrates tick volume data to verify if a bounce has the "fuel" necessary to sustain a Trend Reversal.
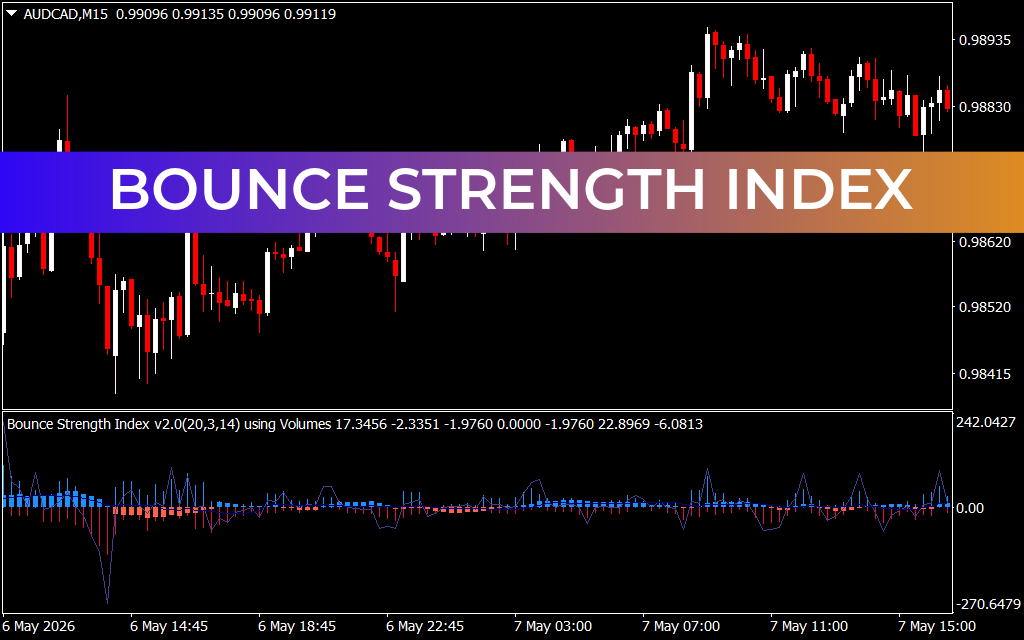
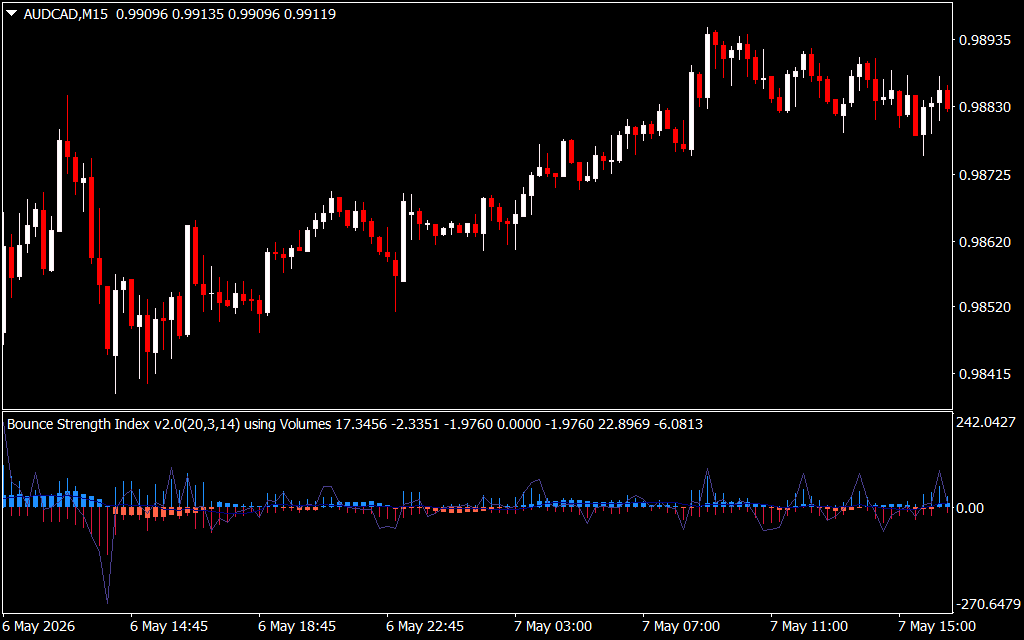
As seen in the AUD/CAD M15 chart, the indicator sits in a dedicated sub-window, featuring a zero-line histogram and a fast-reacting signal line. The primary function of the BSI is to distinguish between a weak "dead cat bounce" and a high-conviction institutional reversal.
Key Features of Version 2.0
The "v2.0" designation marks a significant leap in algorithmic precision. This version includes:
- Volume Integration: It calculates the ratio of buying vs. selling pressure during a price touch, ensuring you only trade bounces backed by significant market participation.
- Dual-Tone Histogram: The histogram bars change color (often blue and red) to signify whether the bounce strength is accelerating or decaying.
- Smoothing Filters: Enhanced noise reduction allows the BSI to remain stable on lower timeframes like the M15, providing clear signals without the "whipsaw" common in lesser indicators.
Strategic Trading with BSI
To get the most out of the Bounce Strength Index, traders should look for Confluence Zones. When the price of a currency pair hits a major support level—such as the regression channel boundaries seen in the daily AUD/CAD charts—and the BSI shows a sharp spike in positive strength, the probability of a successful long trade increases exponentially.
- Reversal Confirmation: Wait for the signal line to cross the zero-level. A cross above zero combined with rising blue histogram bars is a powerful "buy" signal.
- Divergence Detection: If price makes a lower low but the BSI makes a higher low, you have identified a bullish divergence. This suggests that while price is falling, the selling pressure is exhausting, and a massive bounce is imminent.
- Trend Following: During a strong trend, the BSI helps you identify "buy the dip" opportunities. A shallow dip in price accompanied by a small, controlled move in the BSI indicates a healthy correction rather than a trend change.
The Bounce Strength Index v2.0 is more than just a momentum tool; it is a specialized filter for high-probability execution. By focusing on the strength of the rejection rather than just the price level, it gives traders the confidence to trade against the immediate crowd and align themselves with the true market movers.
1 Download
Last Update:
May 10, 2026 02:38 AM
Published:
Jan 24, 2026 14:52 PM
Category: