The Breakout Indicator for MT5 is a powerful tool designed to identify maximum and minimum price levels for selected periods, helping traders spot key breakout zones. By automatically detecting strong Support And Resistance levels, this indicator enables both beginners and experienced traders to take positions early in market trends. Whether the market is trending or moving sideways, the Breakout indicator simplifies identifying high-probability buy and sell levels.
How the Breakout Indicator Works
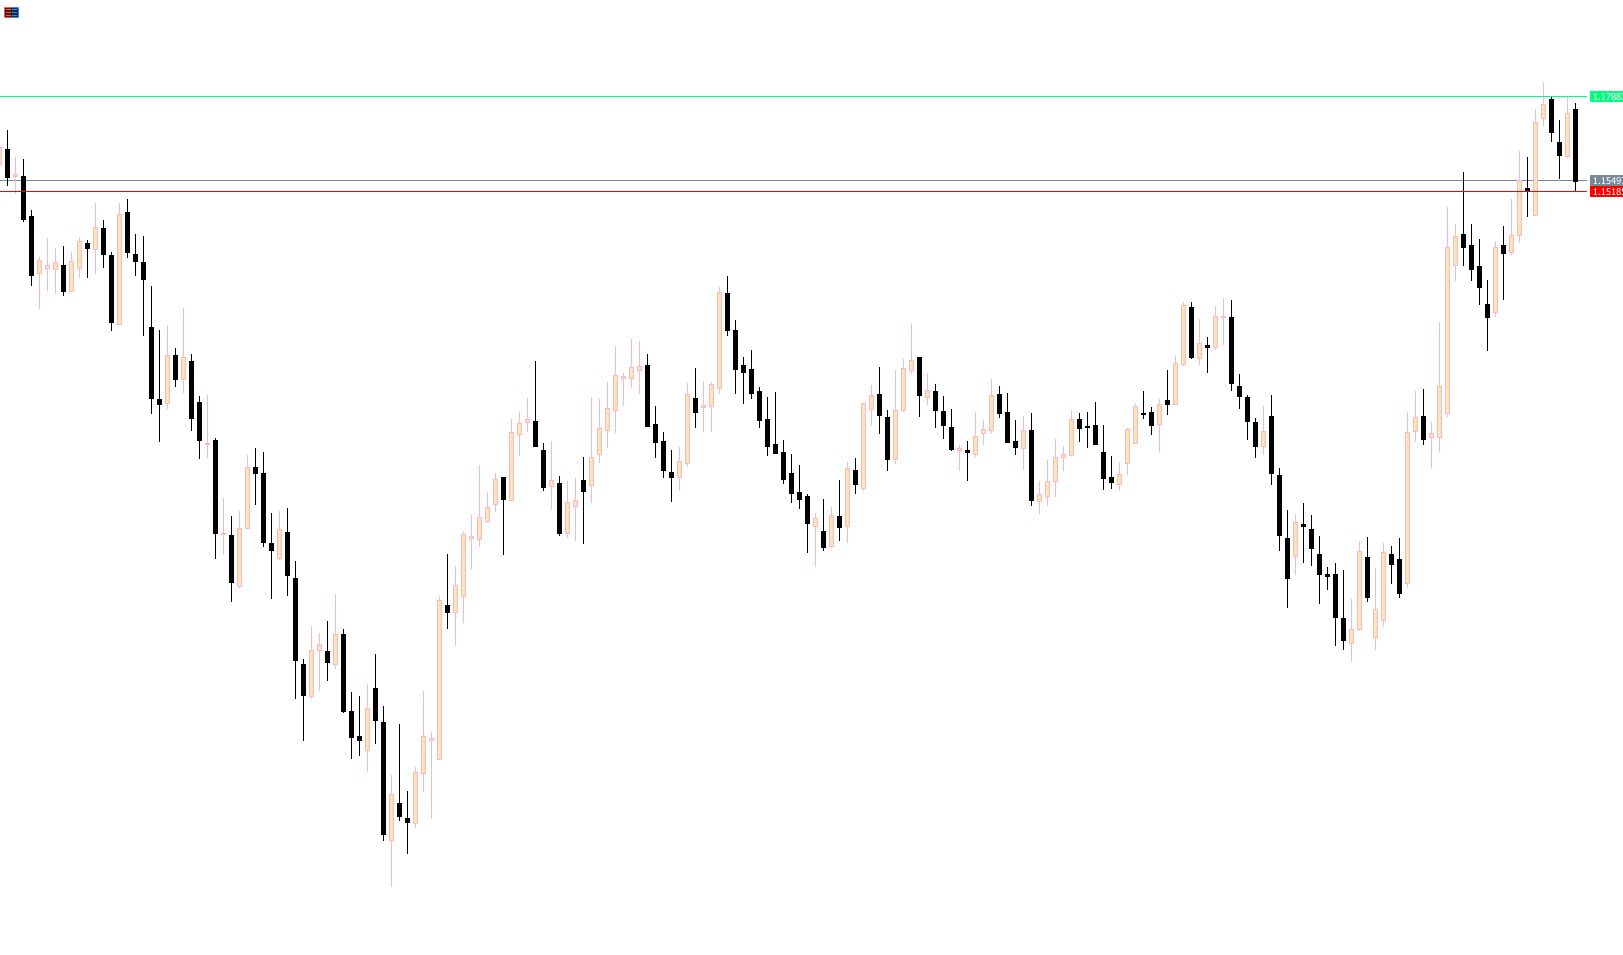
The indicator calculates support and resistance levels based on recent price data, typically using the high and low of the last 5 days by default. The green horizontal line represents resistance, while the red horizontal line shows support. When the price breaks above the resistance, it signals a potential buying opportunity. Conversely, a break below support signals a potential short-selling opportunity.
Benefits of Using the Breakout Indicator
Automatic Level Detection – Instantly identify daily, weekly, or monthly highs and lows.
Scalping and Day Trading – Find short-term opportunities while also spotting longer-term breakout levels.
Trend Early Detection – Catch trends early and maximize profit potential.
Customizable – Adapt the indicator to different timeframes and trading strategies.
Beginner-Friendly – Simplifies support/resistance analysis for novice traders.
Trading Strategies Using the Breakout Indicator
Confirm the Breakout: Wait for price action confirmation, such as bullish or bearish Candlestick Patterns, before entering a trade.
Bullish Breakout Example: One or more bullish candles closing above the resistance line indicates a successful breakout. Traders may enter a BUY position accordingly.
Bearish Breakout Example: If the price breaks below support, consider a SELL position after confirming the breakout with Price Action.
False Breakouts: Occasionally, the price may create a false breakout. In such cases, observe price reversal signals and consider trading in the opposite direction of the initial breakout attempt.
How Traders Benefit
The Breakout indicator provides clear visual cues for support and resistance, allowing traders to react quickly to price movements. This is especially useful for scalpers seeking fast profits and day traders looking to catch trends early. By combining breakout signals with price action analysis, traders can make more informed and higher-probability trading decisions.
Conclusion & Call-to-Action
The Breakout indicator for MT5 is an essential tool for anyone looking to trade breakouts efficiently. By automatically highlighting support and resistance levels and helping confirm price movement with price action signals, it increases your chances of entering trades at the right time. Download the Breakout indicator today and enhance your MT5 trading strategy. Visit IndicatorF
FAQ
5 Downloads
Published:
Nov 13, 2025 23:43 PM
Category: