Master High-Probability Reversals with the WLX Fractal Indicator
Pinpoint accuracy is the holy grail for short-term scalpers and day traders alike. In highly liquid markets, minor price fluctuations often masquerade as structural trend changes, tricking retail traders into premature market entries. If you are tracking major currency pairs like the EUR/USD on lower timeframes, you need a mechanism that separates minor market noise from true swing high and swing low points. The WLX Fractal indicator is designed to do exactly that by filtering Price Action through automated mathematical geometry.
What is the WLX Fractal Indicator?
The WLX Fractal indicator is an advanced technical analysis tool optimized for modern trading platforms like MetaTrader. It builds upon Bill Williams' classic fractal theory, which posits that financial markets are chaotic, recurring, and driven by self-similar mathematical patterns across all timeframes.
A standard fractal requires a specific five-bar sequence where the middle candlestick breaks completely above or below the surrounding two bars. The WLX Fractal indicator takes this mathematical baseline and sharpens its precision. By instantly sweeping your active workspace, it filters out incomplete repetitions and overlays clean, real-time visual signal arrows directly onto your charting screen.
Key Technical Features and Trading Benefits
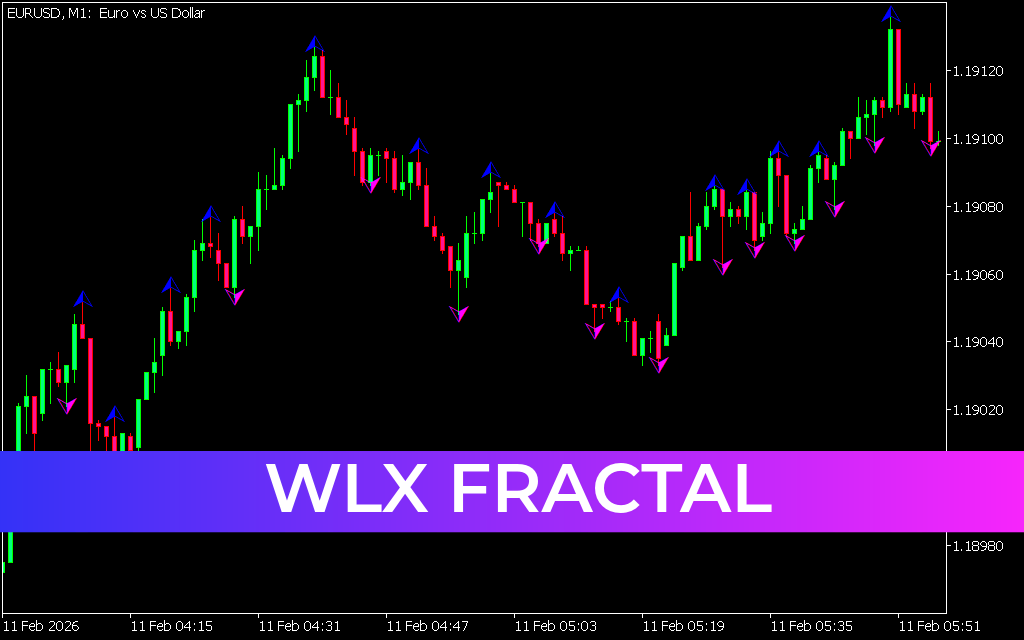
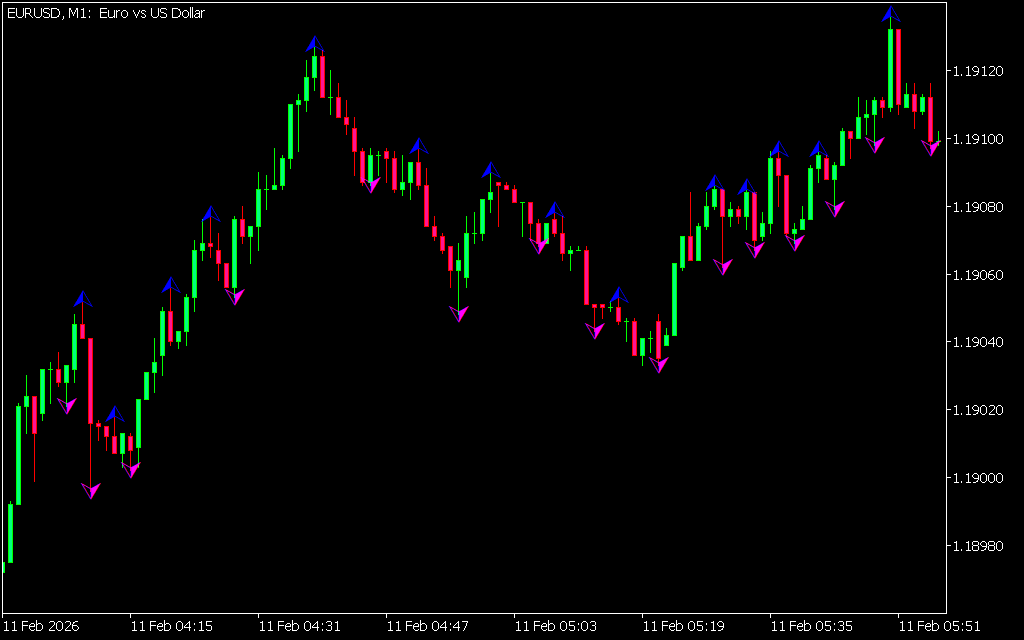
- Instant Visual Signal Overlays: The indicator removes visual confusion by placing clear blue upward arrows at valid structural bottoms and pink/magenta downward arrows at verified structural tops.
- Noise Reduction Filtering: Unlike basic fractal setups that tag every minor pause in price action, the WLX variation uses a refined algorithm to ensure arrows only print on statistically significant turning points.
- Multi-Timeframe Versatility: As demonstrated on the fast-paced 1-minute (M1) interval, it handles rapid price updates efficiently. It is equally robust when used on higher intervals like the 1-hour (H1) or 4-hour (H4) charts for swing trading setups.
- Impeccable Interface Harmony: The software operates seamlessly alongside standard Japanese candlesticks, making it a perfect foundation to layer with external volume tools, moving averages, or Fibonacci levels.
How to Trade with WLX Fractal
Trading successfully with the WLX Fractal indicator centers on utilizing its signals as localized Support And Resistance confirmations.
- Bullish Reversal Entries: Watch for price action to drop into a known historical support level or demand zone. When a blue upward-pointing arrow appears at the bottom of a candlestick, it confirms that selling pressure has dried up. Execute a long position at the close of the candle, setting a protective stop-loss safely below the fractal low.
- Bearish Reversal Entries: Conversely, when the market climbs to a verified supply zone and prints a pink downward-pointing arrow at a candle peak, buyer exhaustion is verified. Execute a short entry to capture the descending leg of the market expansion.
Streamline your chart setup and take the guesswork out of structural mapping by downloading the WLX Fractal indicator today.
2 Downloads
Last Update:
May 19, 2026 16:42 PM
Published:
Jan 19, 2026 14:13 PM
Category: