Mastering Market Trends with the ADXVMA Histogram Indicator
In the world of technical analysis, the challenge has always been distinguishing between a true market trend and "market noise." Standard moving averages often suffer from lag or provide false signals during sideways consolidation. The ADXVMA Histogram indicator for MT4 and MT5 is a sophisticated solution designed to filter out market volatility and highlight high-probability trend directions with visual clarity.
What is the ADXVMA Histogram?
The ADXVMA (Average Directional Volatility Moving Average) is an advanced adaptation of a moving average that incorporates a volatility factor. Unlike a simple moving average that treats all price movement equally, the ADXVMA adjusts its sensitivity based on the strength of the trend. When the market is trending strongly, the indicator follows closely; when the market is flat or noisy, the indicator flattens or remains neutral.
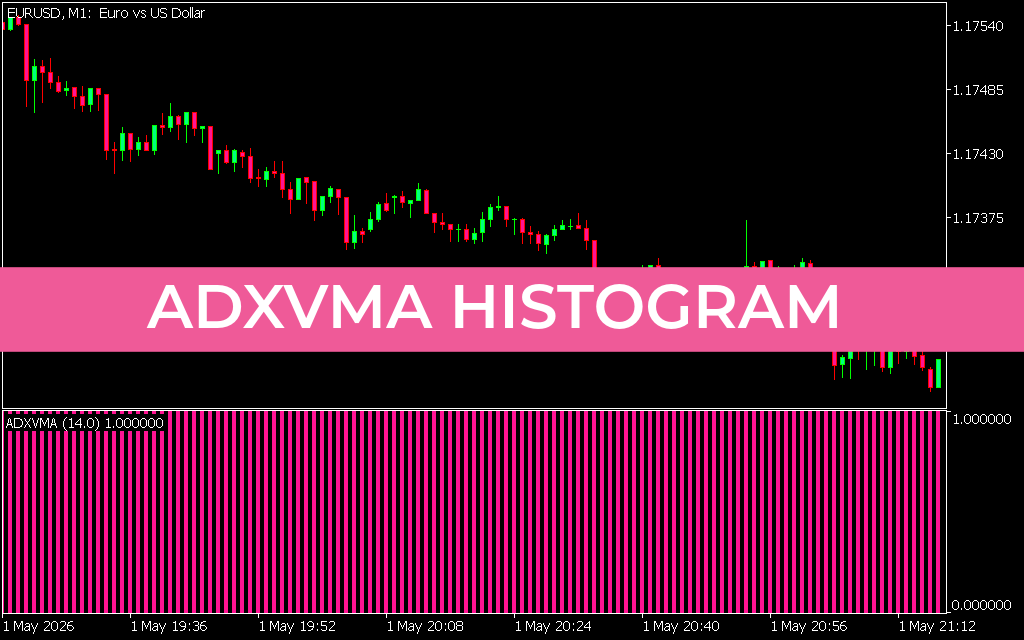
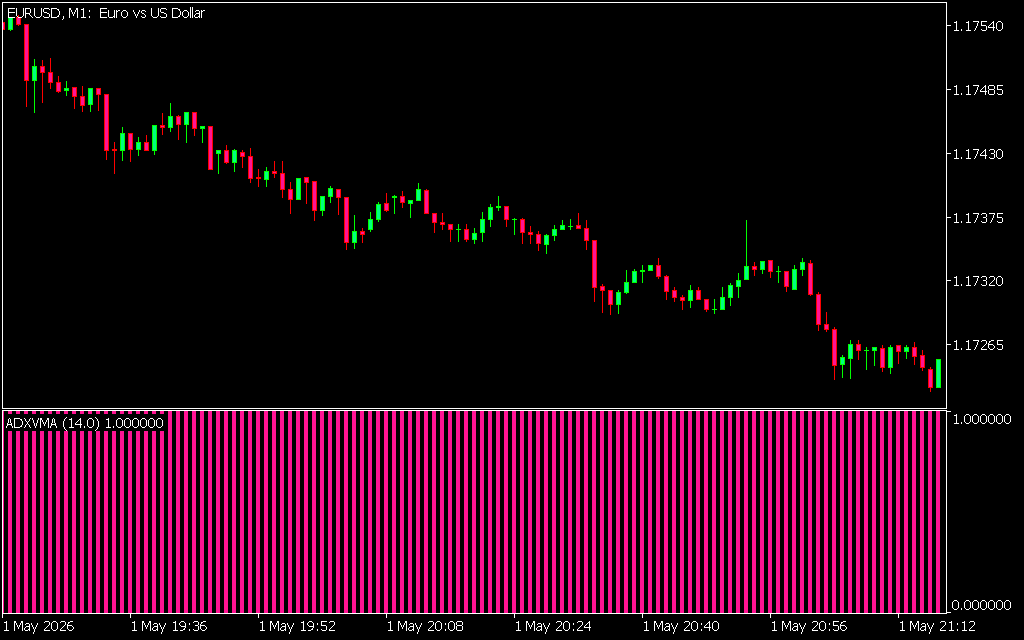
The Histogram version of this tool takes that complex calculation and translates it into a vertical bar format at the bottom of your chart. This makes it an excellent "confirmation" tool, allowing traders to see at a glance whether the current momentum aligns with their trade thesis.
Key Benefits of Trading with ADXVMA
The ADXVMA Histogram stands out because of its unique ability to handle market "choppiness." Here is why it is a favorite for many technical traders:
- Dynamic Smoothing: It uses a modified ADX (Average Directional Index) to measure Trend Strength, which allows the moving average component to be much smoother than traditional EMAs or SMAs.
- Visual Trend Confirmation: By utilizing a histogram, the indicator removes the clutter from the main price chart. Traders can use it to stay in a trend longer, exiting only when the histogram bars signal a change in momentum.
- Reduced False Signals: Because it remains "flat" during periods of low volatility, it helps traders avoid entering trades during dangerous range-bound markets where stop-losses are frequently hunted.
How to Implement the ADXVMA Histogram
To get the most out of the ADXVMA Histogram, it is best used as a filter alongside a primary entry signal. For example, if your price action strategy suggests a "Sell" on the EUR/USD 1-minute chart, you would look at the ADXVMA Histogram for confirmation. If the bars are consistently showing strong downward momentum, the probability of a successful trade increases significantly.
The indicator is highly customizable. Traders can adjust the period (commonly set to 14) to better suit their specific timeframe, whether they are Scalping the M1 charts or analyzing daily trends. For those looking to refine their strategy and eliminate the stress of manual trend identification, the ADXVMA Histogram provides a data-driven, objective edge.
4 Downloads
Last Update:
May 02, 2026 15:46 PM
Published:
Jan 29, 2026 12:39 PM
Category: