Mastering Volatility Swings: Dynamic Trend Following with B-Bands Stop V1
In fast-moving financial markets, the primary challenge for intraday scalpers and swing traders is protecting their trading capital from volatile price spikes. On intermediate intervals like the 1-hour (H1) chart, highly liquid currency pairs such as the EUR/USD constantly undergo sudden transitions between tight consolidations and explosive trend extensions. Traditional static Support And Resistance lines fail to adjust to these changing market conditions. Without an objective, volatility-based infrastructure to lock in open profits and identify trend reversals, retail traders often suffer from emotional hesitation—either exiting highly profitable trends too early or riding a severe pullback all the way to their stop loss.
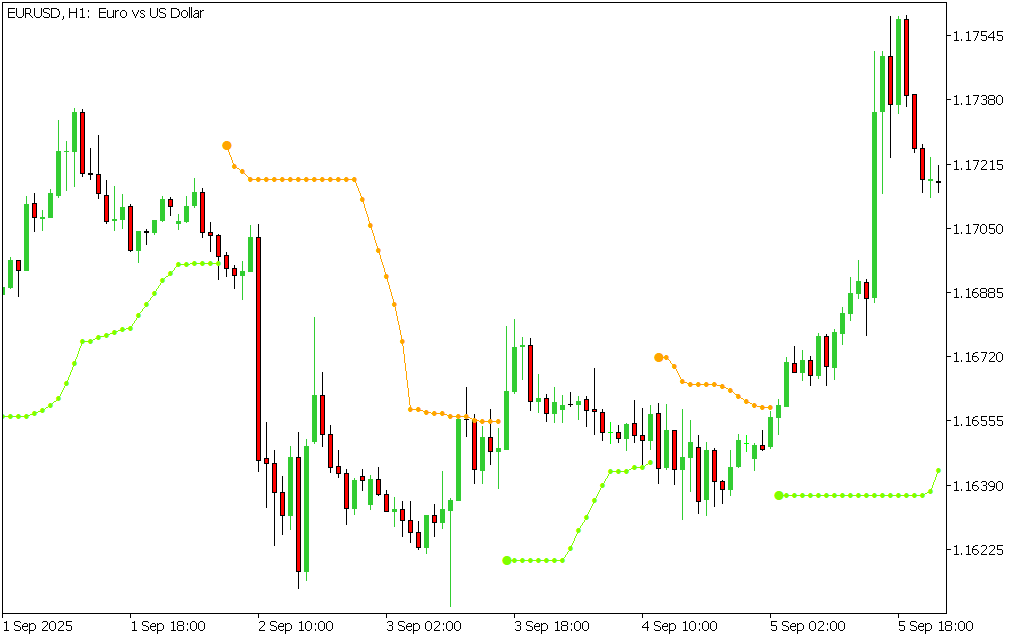
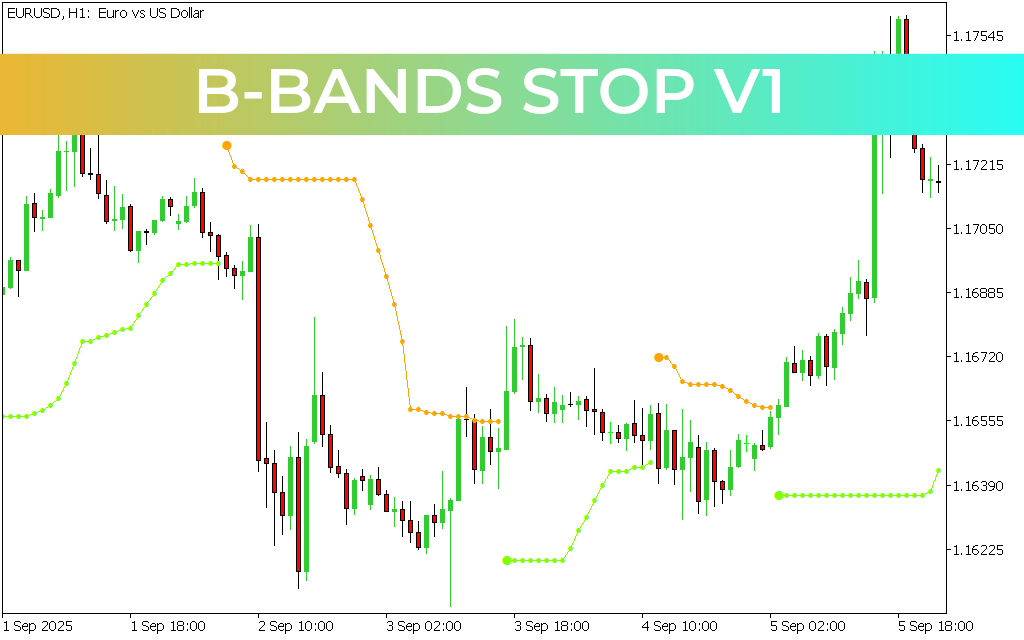
A technical analysis of the EUR/USD H1 price delivery demonstrates a beautiful sequence of market cycles. The asset initially printing a volatile, grinding consolidation base, establishing a solid structural support floor near the 1.16225 handle. Following a comprehensive clean-out of short-term retail liquidity, a massive surge of institutional buying volume floods the terminal. This sustained influx of capital initiates an aggressive, vertical markup phase that easily splits through multiple historical resistance ceilings, driving the exchange rate past 1.17545. Systematically riding this massive directional wave without getting whipsawed requires a dynamic technical filter—specifically, the B-Bands Stop V1 indicator.
The Architecture of Volatility-Smoothed Stop Placement
The B-Bands Stop V1 indicator reengineers classic standard deviation calculations to create an intelligent, adaptive trend-following matrix. By analyzing rolling price volatility, the algorithm projects a sequence of precise tracking dots directly onto your main workspace, functioning as a real-time trailing stop and directional bias filter:
- Sustained Bullish Trailing Infrastructure (The Light Green Trailing Dots): The exact moment institutional buyers capture control of the market floor near 1.16225, the software prints a series of tight, light green dots beneath the candlesticks. As the vertical markup accelerates toward 1.17545, these dots track price continuously. This boundary acts as a mechanical trailing stop, giving swing traders the exact data needed to lock in profits while giving the asset room to breathe.
- Sustained Bearish Supply Protection (The Orange Trailing Dots): Conversely, during primary structural markdowns or intensive institutional selling phases, the indicator switches to an orange dot sequence running above the Price Action. This ceiling serves as a dynamic supply boundary, alerting day traders to focus exclusively on high-probability sell configurations.
- Instant Reversal Signals: A definitive trend shift is confirmed the moment a candlestick breaks and closes completely past the active dot boundary, causing the software to instantly flip colors and prepare you for the next major expansion wave.
Streamlining Platform Performance and Risk Parameters
Sustaining a long-term mathematical edge relies on removing human bias from your daily analysis template. Automating your trend tracking with an advanced Bollinger-based volatility matrix replaces subjective chart drawing with clinical discipline.
The B-Bands Stop V1 script features a highly optimized backend, ensuring smooth data streaming across your MetaTrader terminal without inducing performance lag or chart drag. The customizable interface allows you to fine-tune standard deviation multipliers, modify lookback periods to suit varying asset classes, and set up instant push alerts. Integrating this robust tool into your platform gives you the visual clarity needed to survive retail whipsaws, protect your equity curve, and trade in perfect harmony with market volatility.
5 Downloads
Last Update:
May 20, 2026 16:56 PM
Published:
Jan 18, 2026 14:46 PM
Category: