Unlock Advanced Market Geometry with the MTF Fractals Indicator
In the world of technical analysis, fractals are more than just simple geometric patterns; they are the recurring mathematical signatures of market sentiment. Developed initially by Bill Williams, fractals identify turning points where price attempts to break out but fails, creating a temporary peak or trough. The MTF (Multi-Timeframe) Fractals Indicator takes this classic concept and supercharges it for the modern MetaTrader platform, allowing traders to see structural shifts across multiple timeframes without ever leaving their current chart.
The Power of Fractal Confluence
The primary limitation of standard fractal indicators is their narrow focus. A fractal on a 1-minute chart (M1) might suggest a reversal, but that signal is often insignificant if it contradicts the structure of a higher timeframe like the H1 or D1. The MTF Fractals indicator solves this by overlaying fractals from higher timeframes onto your current view.
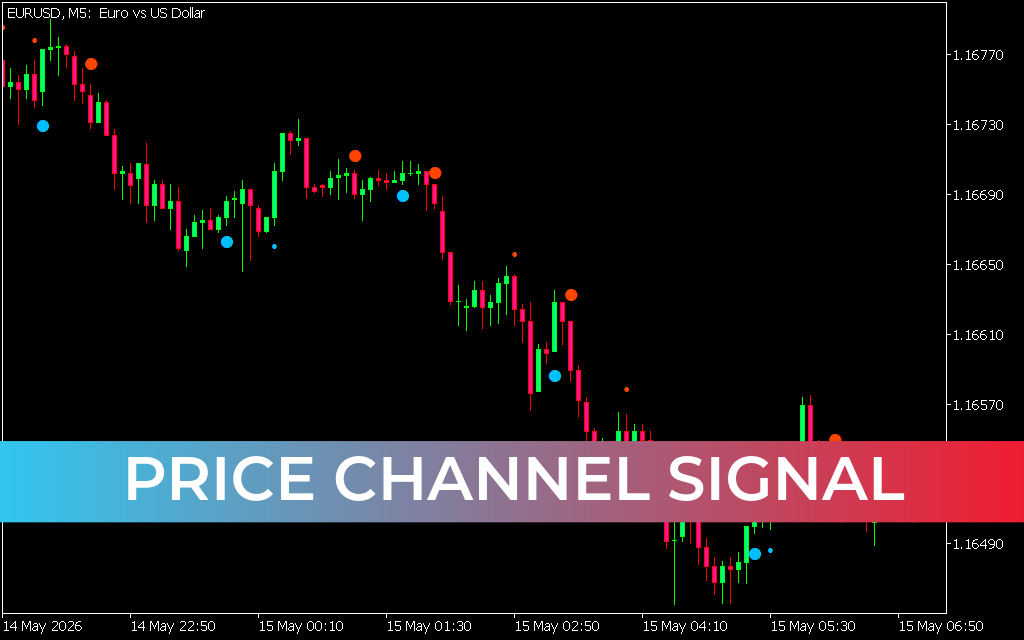
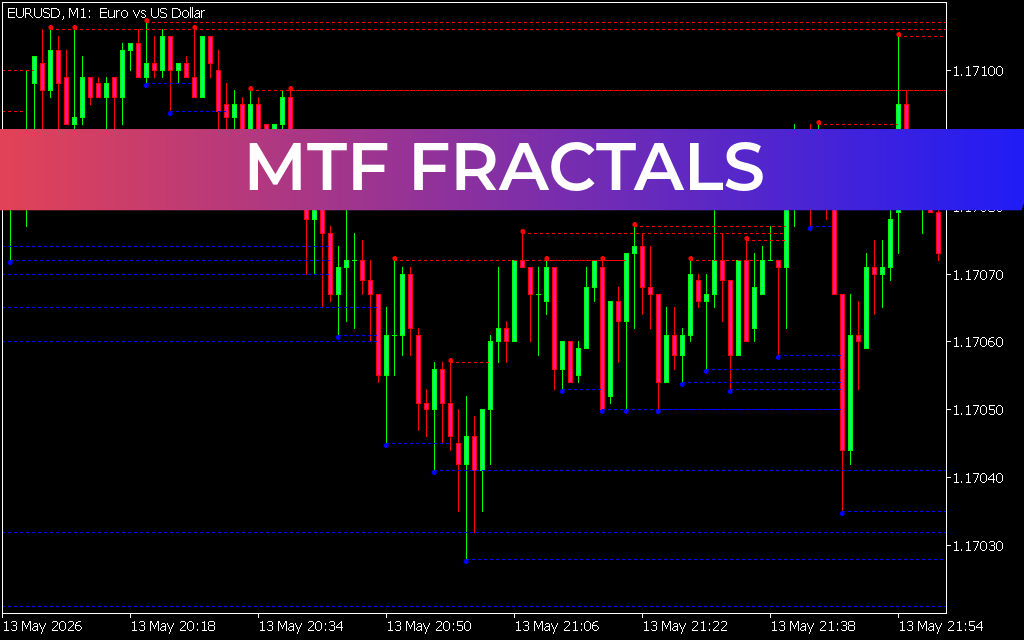
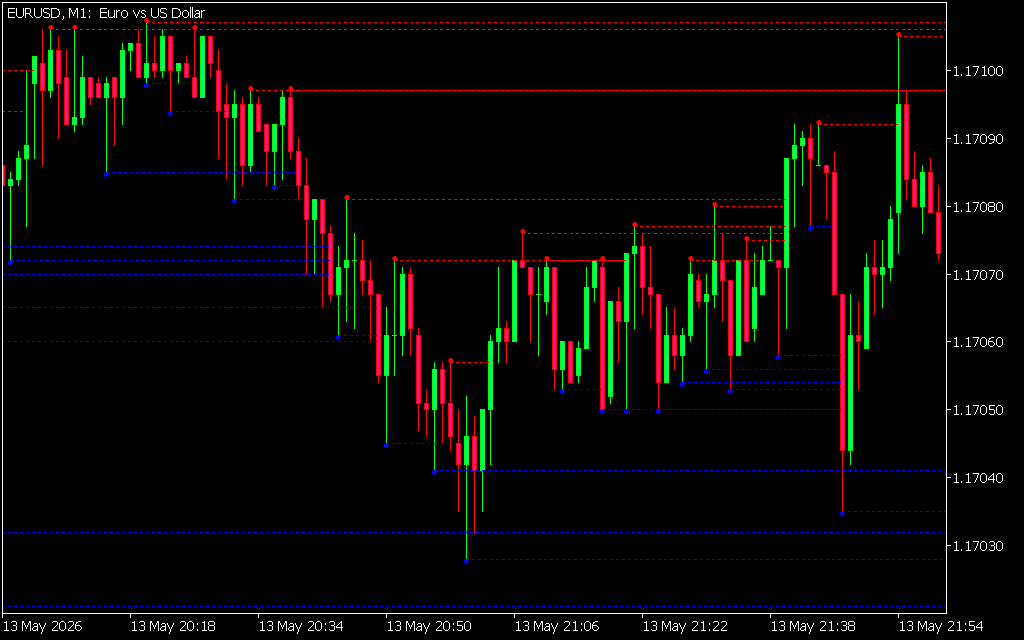
As seen in the EUR/USD M1 chart, the indicator plots colored dots (typically red for resistance and blue for support) at critical swing points. When a fractal from a higher timeframe aligns with one on your execution chart, you have identified a "confluence zone"—a high-probability area where institutional orders are likely clustered.
Key Features and Trading Benefits
- Multi-Timeframe Visibility: View M15, H1, or H4 fractal levels directly on your Scalping chart. This ensures you are always aware of major structural "ceilings" and "floors" that could stop a price move in its tracks.
- Automatic Support And Resistance: Fractals are the purest form of price-action-based support and resistance. By connecting these points, the MTF Fractals indicator helps you visualize horizontal Supply And Demand zones that have been mathematically validated by price reversals.
- Noise Filtering: By focusing on fractals from higher timeframes, traders can effectively filter out the "market noise" that often leads to overtrading. You only take action when the price interacts with a significant, high-level fractal point.
- Trend Confirmation: In a healthy uptrend, price consistently breaks through resistance fractals while respecting support fractals. The MTF Fractals indicator makes this progression instantly visible, helping you stay on the right side of the trend.
Strategic Application for Scalpers and Day Traders
For a scalper, the MTF Fractals indicator serves as a definitive "road map." A common strategy involves waiting for the price to approach a higher-timeframe fractal level. If the price fails to break that level and a new execution-timeframe fractal forms in the opposite direction, it signals a powerful reversal trade.
On the provided EUR/USD chart, notice how the horizontal dashed lines extend from the fractal points. These lines act as immediate targets for Take Profit (TP) or logical levels for trailing Stop Loss (SL) orders. By trading "from level to level," you remove the emotional guesswork and rely on the objective geometry of the market.
Conclusion
The MTF Fractals Indicator is an essential upgrade for any Price Action trader. It transforms a simple reversal signal into a comprehensive multi-timeframe structural analyzer. By providing clear targets and robust trend filtering, it empowers you to trade with the precision and discipline of a professional.
6 Downloads
Last Update:
May 14, 2026 01:43 AM
Published:
Jan 22, 2026 18:40 PM
Category: