Master Momentum and Breakouts with the Price Channel Signal Indicator
In the world of professional technical analysis, identifying the boundaries of market volatility is the key to capturing explosive moves. The Price Channel Signal indicator for MetaTrader is a high-performance tool designed to define the "playing field" of Price Action. By tracking the highest highs and lowest lows over a specific look-back period, this indicator provides traders with a clear, algorithmic map of support, resistance, and momentum shifts.
The Mechanics of the Price Channel
The logic of the Price Channel is based on the Donchian Channel principle. It plots two outer bands—an upper boundary representing the maximum price reached and a lower boundary representing the minimum price reached within a set number of candles. When the market is in a strong trend, price "hugs" these boundaries; when the market consolidates, the bands contract, signaling an impending volatility squeeze.
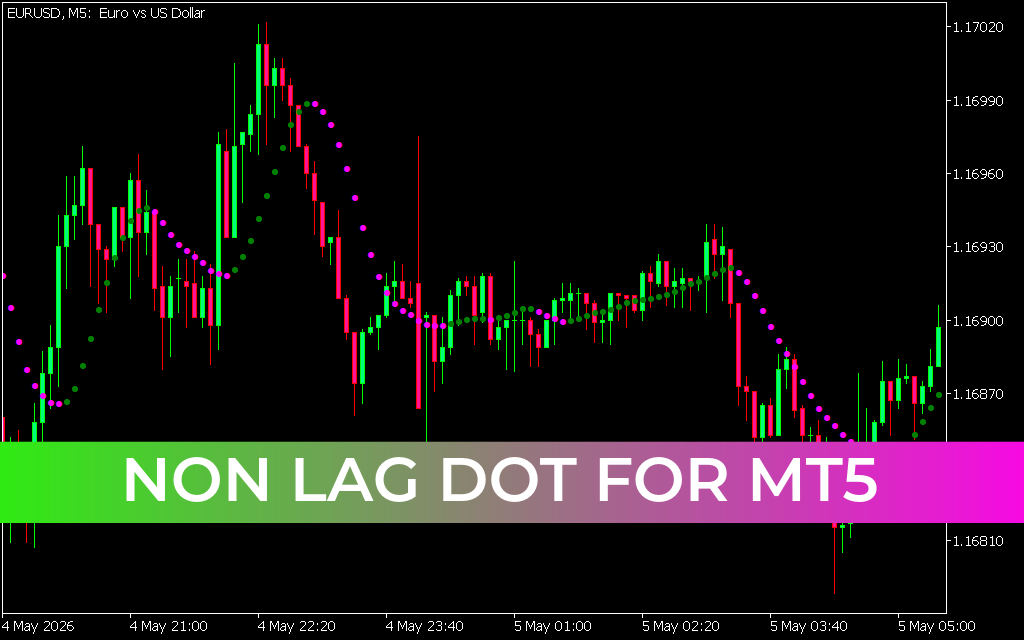
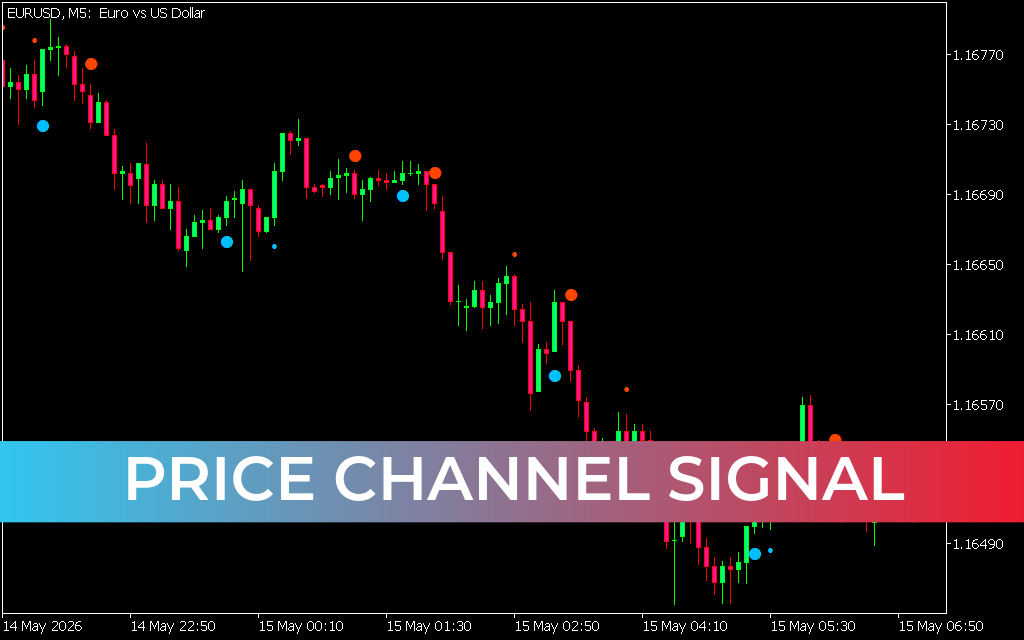
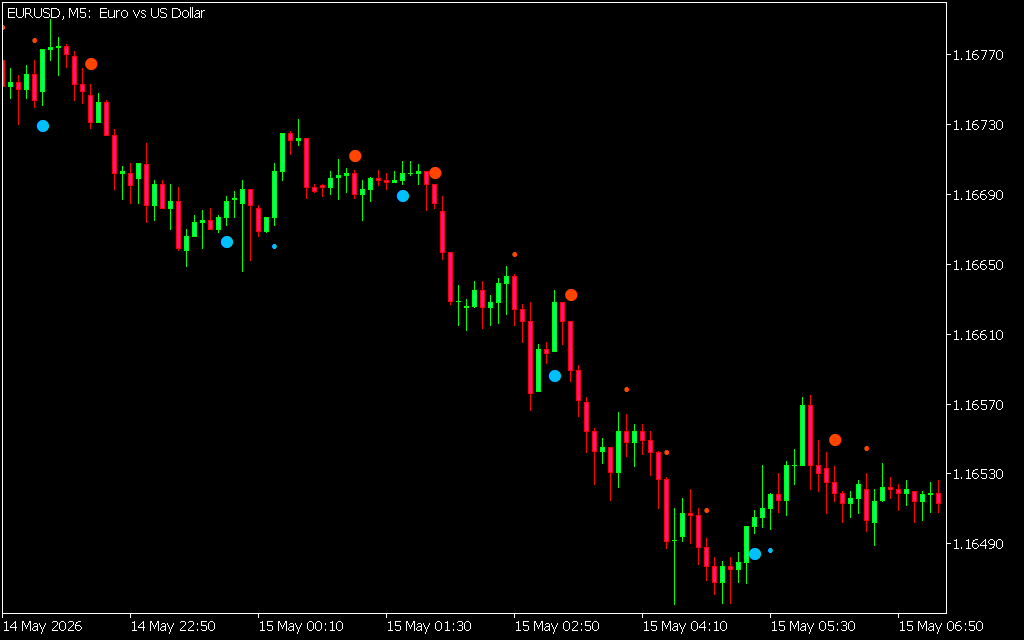
As shown in the EURUSD M5 chart, the indicator simplifies complex price action into actionable zones:
- The Upper Band: Acts as a dynamic resistance level. A break above this line suggests that bulls have gained enough strength to push the market into new territory.
- The Lower Band: Serves as dynamic support. A break below this level indicates that bearish pressure is mounting.
- Signal Dots: To enhance execution, the indicator often plots visual dots (Blue for buy, Orange for sell) at the exact moment a breakout or reversal is confirmed.
Strategic Implementation: Trend Following and Mean Reversion
The versatility of the Price Channel Signal makes it a staple for various trading styles:
- Breakout Trading: This is the most popular application. Traders wait for a candle to close outside the upper or lower band. In the provided M5 analysis, blue dots identify successful bullish breakouts, allowing traders to enter early in a new momentum wave.
- Volatility Squeezes: When the channel narrow significantly, it indicates a period of low volatility. Savvy traders use this as a warning to prepare for a "breakout expansion," as markets typically transition from low volatility to high volatility rapidly.
- Stop-Loss Management: The bands provide a logical place for risk management. For a long position, a stop-loss can be placed just below the lower channel boundary, moving upward as the trend progresses to lock in profits.
Why Every Intraday Trader Needs This Tool
For scalpers and day traders, "noise" is the greatest enemy. The Price Channel Signal acts as a professional-grade filter, highlighting only the moves that have enough conviction to break historical boundaries. Whether you are navigating the high-speed M1 charts or looking for H1 swing setups, this tool ensures you are never trading blindly against the current of the market.
- Objective Visuals: Replaces subjective trendlines with automated, data-driven boundaries.
- Real-Time Alerts: The inclusion of signal dots allows for rapid decision-making during fast-moving sessions.
- Multi-Asset Reliability: Effective across Forex, Commodities, and Indices, providing a consistent framework for all your charts.
By integrating the Price Channel Signal into your MetaTrader setup, you gain a structural edge that allows you to identify trends as they form and exit before they reverse.
3 Downloads
Last Update:
May 15, 2026 17:02 PM
Published:
Jan 21, 2026 18:35 PM
Category: