Breakout trading is one of the most popular techniques in the forex market because of its potential to generate significant pips. The Breakout Box Indicator for MT4 is a top tool for traders looking to identify key support and resistance zones automatically.
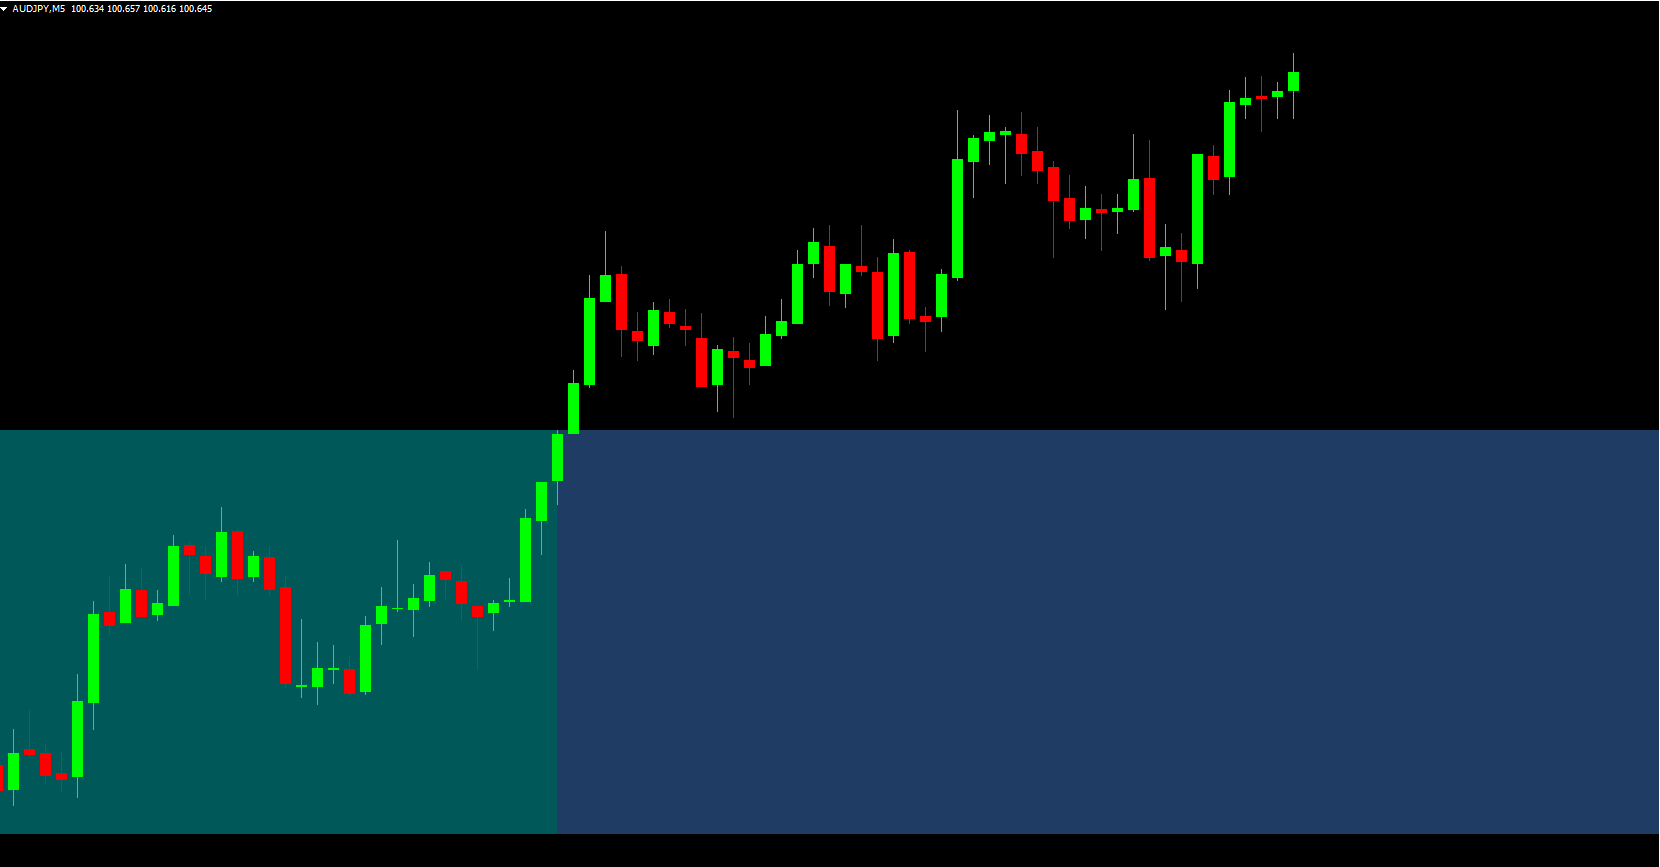
This indicator draws rectangle boxes around significant price areas, providing traders with a visual roadmap to assess potential breakouts. It’s perfect for H1 intraday trading, Scalping, and day trading, giving both novice and experienced traders an edge by highlighting critical price levels at a glance.
How the Breakout Box Indicator Works
The Breakout Box Indicator performs technical analysis on timeframes below H4, making it ideal for short-term trading. It automatically detects and draws boxes around:
Support zones: Areas where price tends to bounce upward.
Resistance zones: Areas where price tends to reverse downward.
These visual boxes allow traders to monitor key breakout levels without manually drawing support or resistance lines, saving time and reducing errors.
Using the Breakout Box Indicator for Buy/Sell Signals
Trend-Following Approach
Identify the overall market trend.
Wait for price to break out of the box and close in the trend direction.
Example: In an uptrend, take a BUY trade after the price breaks and closes above the box.
High-Probability Retest Approach
Wait for price to break out of the box.
Observe the next candlestick; if it retests the box and shows visible rejection (long wick), enter in the direction of the breakout.
This method ensures that the breakout zone is strong and validated, increasing the probability of a successful trade.
Candlestick Confirmation
Combine with engulfing patterns, pin bars, or other candlestick signals for added confirmation.
Helps reduce false breakouts and improves trade accuracy.
Advantages of the Breakout Box Indicator
Easy to Use: Visual rectangles make key zones instantly recognizable.
Saves Time: Automatically draws support/resistance zones, reducing manual analysis.
Flexible: Works with scalping, day, or intraday trading strategies.
Improves Accuracy: Helps traders spot high-probability breakout setups.
Suitable for Beginners: Makes identifying key price levels easier for new traders.
Limitations
Does not send alerts; manual observation is required.
Boxes may slightly adjust until breakout is confirmed.
Best used with good money management, as false breakouts can occur.
Recommended Complementary Tools
For enhanced breakout trading, consider combining the Breakout Box Indicator with:
Breakout Panca Eagle Indicator – dynamic session breakouts.
SQ Dynamic Breakout Box Indicator – advanced visual breakout logic.
Candlestick analysis – engulfing candles, pin bars.
Moving averages or trend indicators for added Trend Confirmation.
Frequently Asked Questions (FAQ)
Best timeframe? Below H4, with H1 being the most responsive.
Does it repaint? Boxes may slightly adjust until breakout is confirmed.
Can it be combined with other indicators? Yes, works well with Candlestick Patterns, MAs, and session tools.
Alerts? No, manual observation is required.
Suitable for beginners? Yes, especially useful for identifying support/resistance levels.
Can it trade gold or crypto? Yes, provided reliable MT4 data from your broker.
Conclusion
The Breakout Box Indicator for MT4 is an essential tool for traders seeking efficient breakout setups. By automatically drawing key Support And Resistance zones, it provides a visual guide for potential price movements, making it easier to identify high-probability BUY and SELL signals.
Although it doesn’t provide automatic alerts, combining this indicator with Price Action analysis and other tools can significantly improve trading performance. Download the Breakout Box Indicator for free from IndicatorForest.com and enhance your breakout trading strategy today.
FAQ
18 Downloads
Published:
Nov 10, 2025 03:57 AM
Category: