The Chaikin Money Flow (CMF) indicator, developed by Marc Chaikin, measures buying and selling pressure over a selected period (commonly 21 days). It combines price and volume to determine whether an asset is being accumulated (bought) or distributed (sold). By identifying shifts in money flow, traders can anticipate potential price reversals or trend continuations early.

The CMF indicator for MT4 can be used on any currency pair and any timeframe.
How the Chaikin Money Flow Indicator Works
The CMF indicator is built upon the idea that:
When the market is strong, prices tend to close near the upper half of their daily range.
When the market is weak, prices tend to close near the lower half of the range.
Because of this, the indicator oscillates between +1 and -1:
Positive CMF values → Buying pressure (accumulation)
Negative CMF values → Selling pressure (distribution)
Key Behaviors
The CMF rises when price closes nearer to the high of the session and volume supports the move.
The CMF falls when price closes nearer to the low of the session with supporting volume.
How to Trade with the CMF Indicator
Buy Signal — Bullish Conditions
A buy signal occurs when:
The indicator value is above the zero line (positive territory).
The CMF value is increasing along with rising prices.
This indicates strong buying pressure and accumulation, suggesting a continuation of the uptrend.
Sell Signal — Bearish Conditions
A sell signal occurs when:
The CMF value falls below the zero line (negative territory).
The indicator decreases along with declining prices.
This signals increasing selling pressure, consistent with a downtrend or distribution.
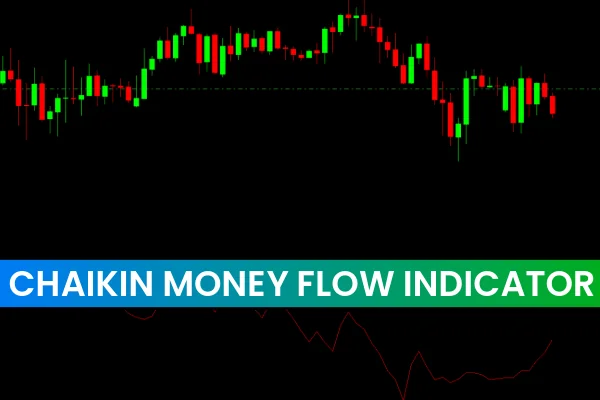
Chart Example Explanation
In the chart (EUR/USD, H4), the red circle shows the CMF moving from positive to negative as prices fall. Candlesticks close near session lows, indicating strong bearish pressure.
During uptrends, shown by the green circle, the CMF moves into positive territory. Price closes near session highs, signaling increasing buying pressure.
The indicator often peaks as price approaches significant resistance zones.
Conclusion
The Chaikin Money Flow indicator is a powerful tool for identifying:
Accumulation vs. distribution
Potential early reversals
As with all indicators, CMF works best when combined with other technical tools and confluence-based strategies. It is freely available for MT4 and easy to integrate into trend-based trading systems.
FAQ
The Chaikin Money Flow (CMF) indicator measures buying and selling pressure over a selected period (commonly 21 days) by combining price and volume to determine whether an asset is being accumulated (bought) or distributed (sold). By identifying shifts in money flow, traders can anticipate potential price reversals or trend continuations early.
CMF values range from -1 to +1. Positive values indicate buying pressure (accumulation), suggesting potential upward price movement. Negative values indicate selling pressure (distribution), suggesting potential downward price movement. Values near zero suggest neutral conditions. The stronger the value (closer to +1 or -1), the stronger the buying or selling pressure.
CMF helps identify when money is flowing into or out of the market, providing early signals of potential trend changes. It combines price and volume analysis, making it more reliable than price-only indicators. The indicator can be used on any currency pair and any timeframe, making it versatile for different trading styles from scalping to swing trading.
Combine CMF with trend indicators like moving averages to confirm direction, use with support and resistance levels to identify high-probability entry points, pair with price action patterns for additional confirmation, and apply multi-timeframe analysis to understand money flow across different timeframes. This helps filter signals and improve trade accuracy.
Enter long positions when CMF crosses above zero and continues rising, indicating accumulation. Enter short positions when CMF crosses below zero and continues falling, indicating distribution. Use CMF divergence (price making new highs while CMF makes lower highs, or vice versa) to identify potential reversals. Combine with trend analysis for best results.
4 Downloads
Published:
Dec 13, 2025 01:59 AM
Category: