The ADX Buy Sell Indicator for MT5 is built on the well-known Average Directional Index (ADX) and its DI+ and DI– components. This technical indicator generates BUY and SELL arrows to mark potential bullish or bearish Price Action. Because the ADX Buy Sell Indicator does not repaint, traders can rely on its signals to build consistent forex strategies—an important advantage for both beginners and advanced traders.
The underlying signal logic comes from the intersection of the DI+ and DI– lines. When momentum shifts, the indicator plots a BLUE arrow for bullish pressure or a RED arrow for bearish pressure. Its straightforward design and high accuracy make it useful for intraday, swing, and long-term trading. Additionally, the indicator installs easily in MT5 and is available for free download, making it accessible to traders of all skill levels.
How the ADX Buy Sell Indicator Generates Trading Signals
Interpreting Bullish and Bearish Arrows
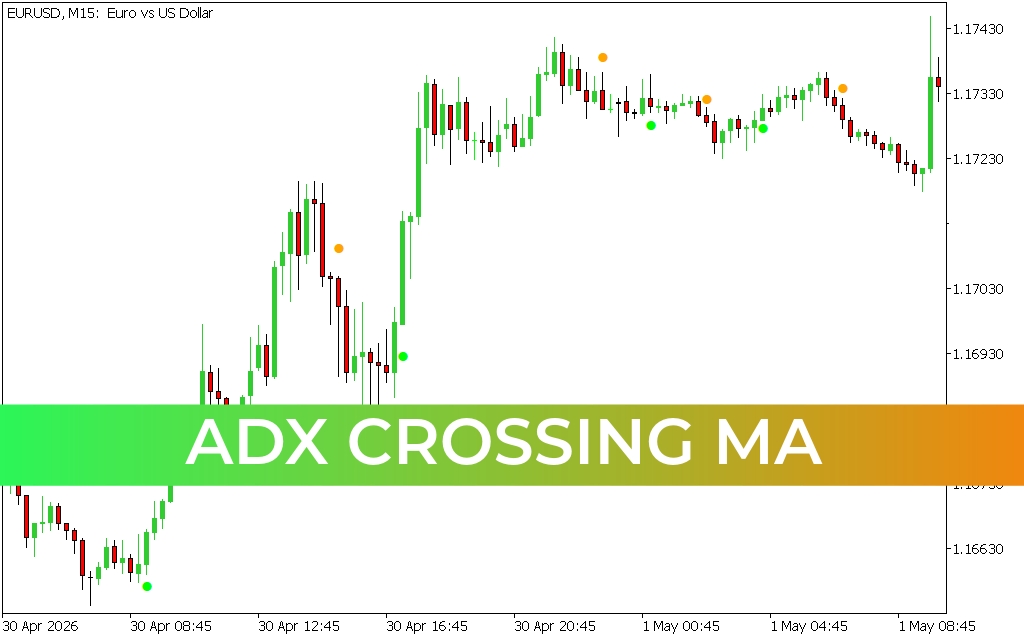
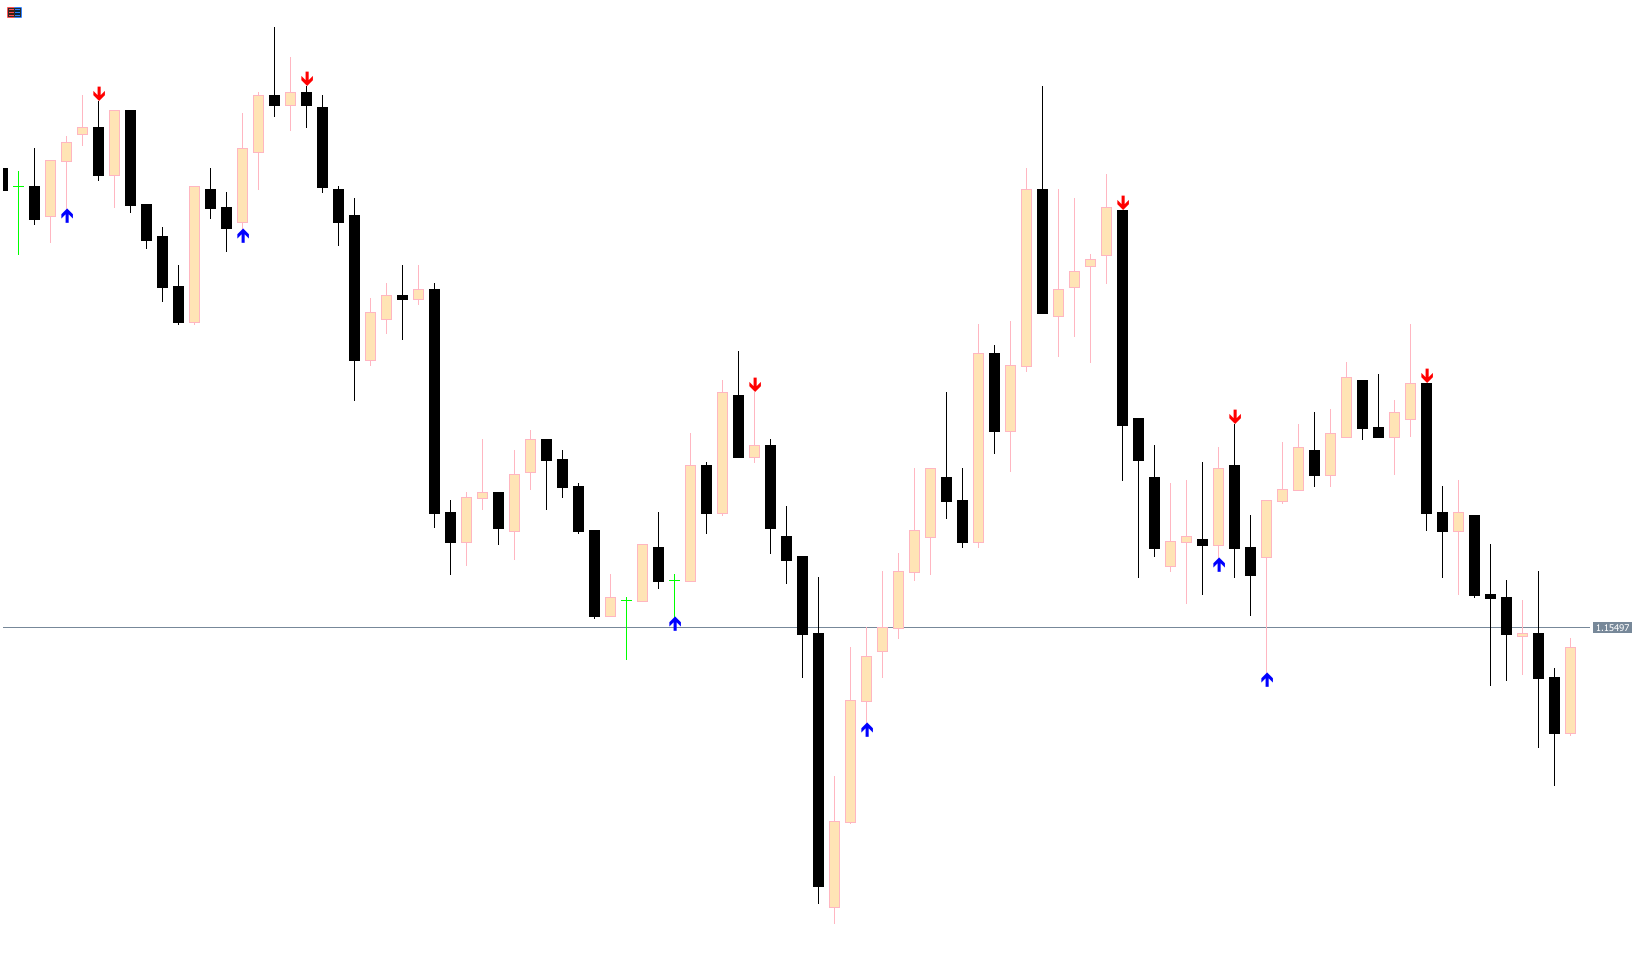
As shown in typical MT5 charts, the ADX Buy Sell Indicator displays BLUE arrows to mark BUY signals and RED arrows to mark SELL signals. These arrows appear when DI+ crosses above DI– (bullish) or DI– crosses above DI+ (bearish). This crossover approach is a proven ADX-based methodology used in countless trend-following systems.
When a BLUE arrow appears, traders may:
Enter a BUY position.
Place the stop loss below the previous swing low.
Consider taking profit when the next opposite signal appears.
Similarly, a RED arrow suggests:
Opening a SELL trade.
Setting the stop loss above the previous swing high.
Exiting the trade when a bullish arrow forms.
Using Price Breakouts for Confirmation
For increased accuracy, traders often wait for price to break above (for buys) or below (for sells) the high or low of the signal candle. This breakout confirms that momentum aligns with the arrow signal. This simple method reduces false entries and increases confidence in directional bias.
Combining Support and Resistance Levels
The ADX Buy Sell Indicator works even better when used with well-defined Support And Resistance zones. When an arrow appears near a key level—such as a retest of a support or resistance break—the signal becomes significantly stronger. Traders can then refine their entry and exit points with higher precision.
When the ADX Buy Sell Indicator Works Best
Trending Market Conditions
The ADX Buy Sell Indicator performs best in trending markets. When price is moving strongly in one direction, DI+ and DI– provide clearer crossovers and more reliable arrow signals. This is especially useful in forex markets like EURUSD, GBPJPY, XAUUSD, and major indices.
Avoiding Ranging Markets
The indicator may produce false signals during flat or sideways markets. For this reason, filtering trades using trendlines, moving averages, the RSI, or the main ADX value is recommended. Ignoring signals that oppose the long-term trend is also a simple but effective risk-reduction strategy.
Pairing with Other Technical Tools
For best results, traders can combine the ADX Buy Sell Indicator with:
Trend filters (Moving Averages, SuperTrend)
Momentum indicators (RSI, MACD)
Breakout tools (Donchian Channels, support/resistance zones)
Sentiment tools and volume indicators
This multi-confirmation approach helps reduce false entries and ensures that trades follow genuine momentum.
Conclusion
The ADX Buy Sell Indicator for MetaTrader 5 is a highly effective tool for traders who want non-repaint BUY and SELL arrows based on reliable ADX crossovers. Its clear visual signals help traders quickly identify bullish and bearish trends, making it suitable for both beginners and experienced professionals. For best performance, use it within trending markets and combine it with additional technical indicators.
To download more free MT4/MT5 tools, visit IndicatorForest.com and explore our growing collection of trading indicators, robots, and strategy guides.
FAQ
42 Downloads
Published:
Dec 02, 2025 02:35 AM
Category: