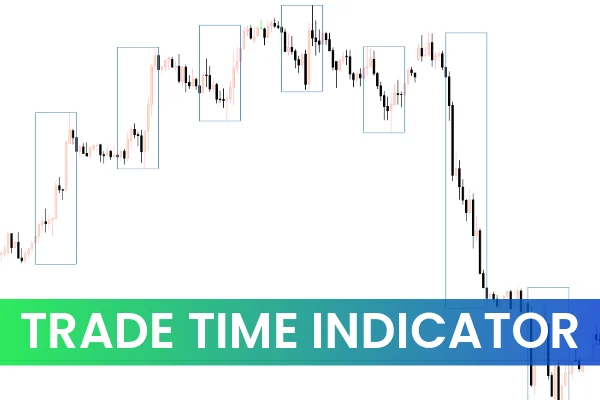
The Trade Time Indicator MT5 is a straightforward yet powerful tool for forex traders seeking to identify the direction of market trends. By drawing rectangles on candles based on the chosen timeframe, the indicator provides a visual guide for the start and end of trends. Whether you are a beginner or an experienced trader, this time-based indicator helps improve trading decisions and efficiency.
How the Trade Time Indicator Works
The Trade Time Indicator plots rectangles on candlestick charts to signal trend direction. The rectangle color and placement indicate whether a trend is bullish or bearish:
Bullish Trend: A rectangle is drawn on a bullish candle, signaling traders to consider opening long positions.
Bearish Trend: A rectangle is drawn on a bearish candle, signaling traders to consider short positions.
The indicator works best on higher timeframes such as H4, daily, and weekly charts. On these timeframes, trends are more reliable, and the indicator helps traders enter positions at the beginning of strong market movements.
Using Trade Time Indicator with Other Tools
For enhanced accuracy, the Trade Time Indicator can be combined with other popular indicators like:
RSI (Relative Strength Index): Confirms overbought or oversold conditions to validate trade entries.
MACD (Moving Average Convergence Divergence): Helps confirm Trend Strength and momentum.
By using confluence from multiple indicators, traders can reduce false signals and increase the probability of successful trades.
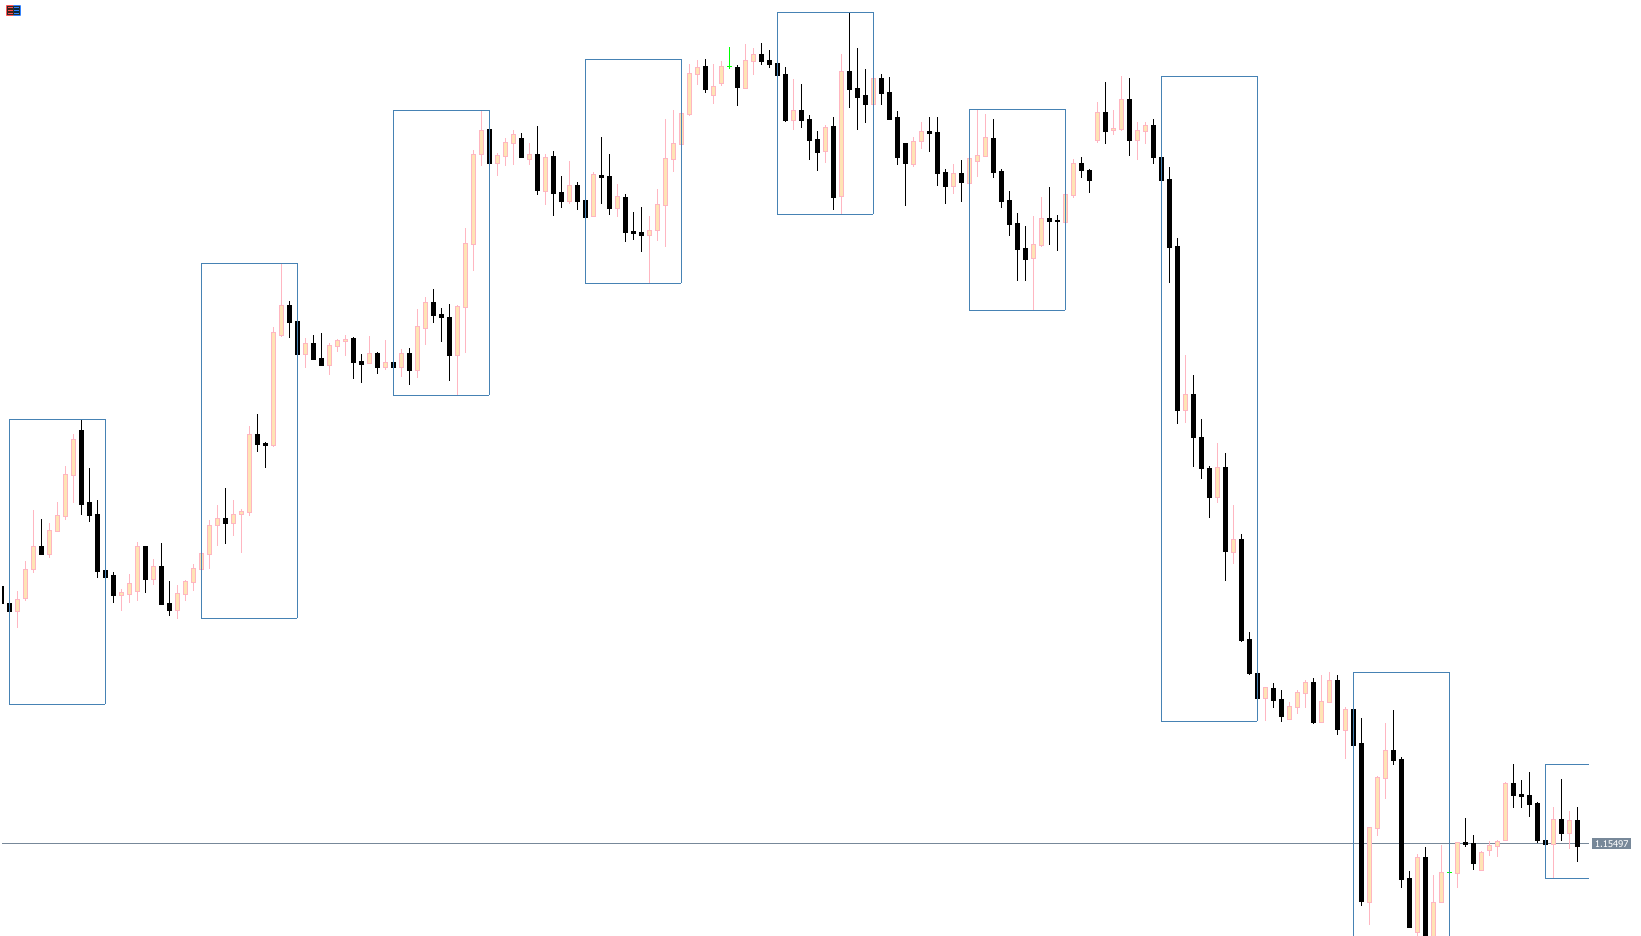
Trade Time Indicator BUY/SELL Signals
The GBP/USD H4 chart demonstrates how the Trade Time Indicator generates BUY and SELL signals:
BUY Signal: When a rectangle appears on a bullish candle at the start of an uptrend, traders can open long positions.
SELL Signal: When a rectangle appears on a bearish candle at the start of a downtrend, traders can open short positions.
The rectangles continue to track the trend, and when a new rectangle appears, it signals the end of the previous trend. This makes it easier to exit trades at optimal points and avoid holding positions during trend reversals.
Advantages of Trade Time Indicator MT5
Clear visual trend indicators on any timeframe
Simple and easy to use for both beginners and advanced traders
Free to download and install on MT5
Works well in combination with other technical indicators
Helps traders identify trend start and end points efficiently
Conclusion
The Trade Time Indicator MT5 is an effective, time-based trading tool that visually highlights trend direction and timing. Traders can quickly identify BUY and SELL signals, making it ideal for higher timeframe trading strategies. Download the indicator for free from IndicatorForest.com and start improving your forex trading today.
Call-to-Action:
Enhance your trading strategy and trade smarter with the Trade Time Indicator MT5. Visit IndicatorForest.com to download it for free.
FAQ
4 Downloads
Published:
Nov 11, 2025 21:57 PM
Category: