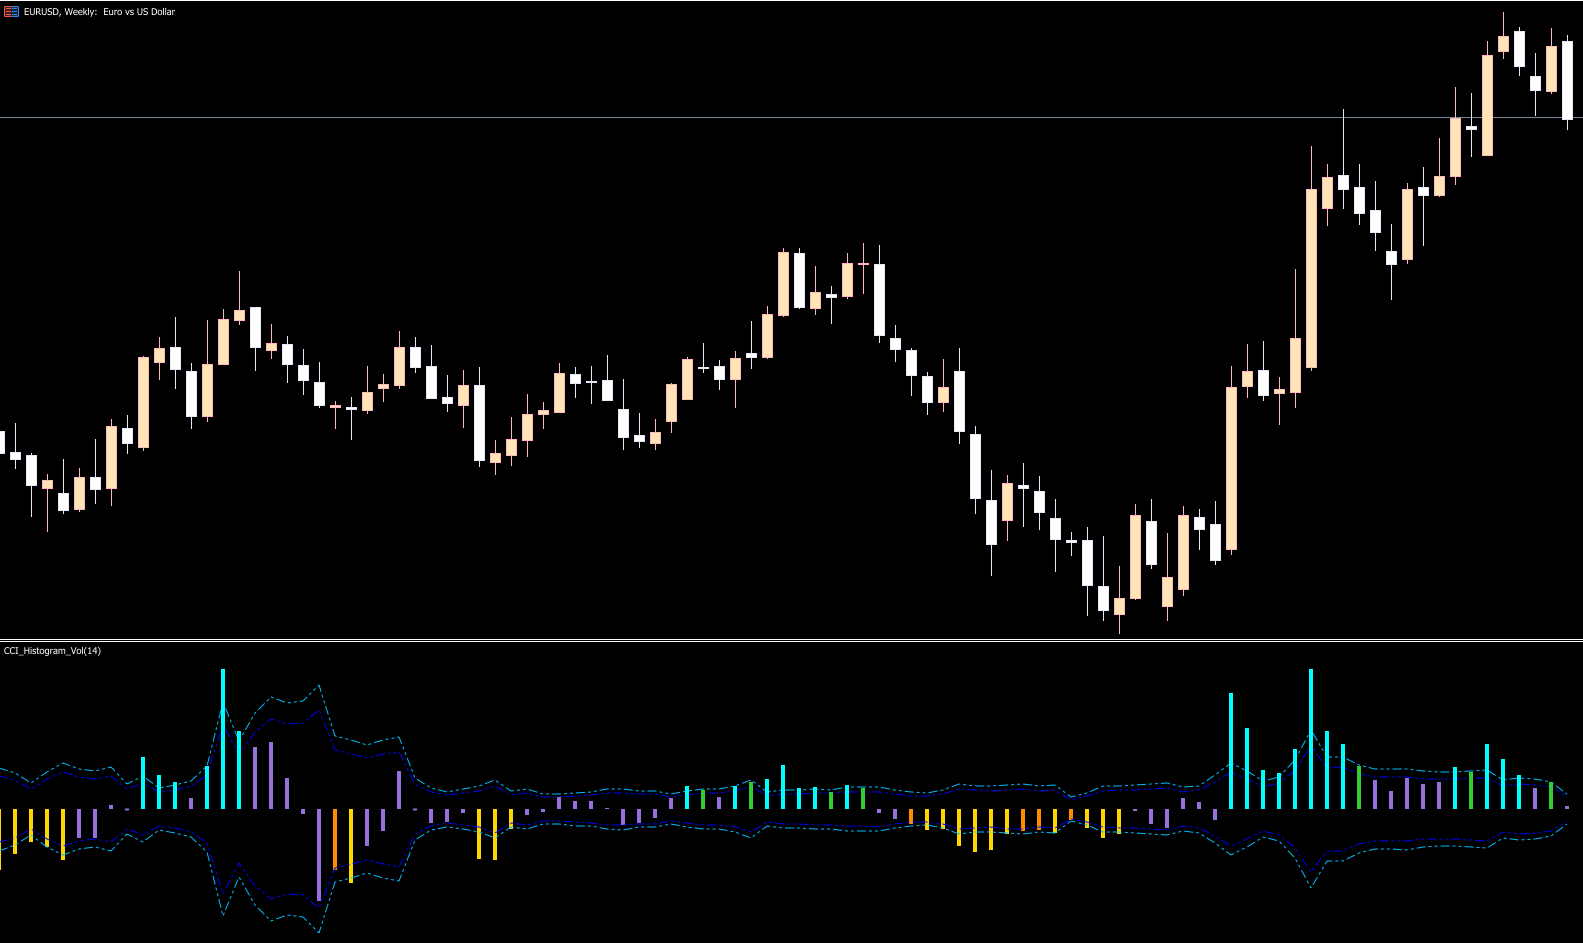
The CCI Histogram Volume Indicator for MT5 is a powerful trend analysis tool based on the Woodies Commodity Channel Index (Woodies CCI). Designed for both beginner and advanced traders, this indicator visually highlights market conditions with a simple histogram. By signaling BULLISH, BEAR, and FLAT market states, traders can make quick and confident trading decisions
.
Because the indicator does not redraw, forex traders can rely on its signals for both intraday and long-term trading strategies.
How the CCI Histogram Volume Indicator Works
The histogram uses three colors to display market trends:
BLUE: BULLISH trend – signals upward momentum and potential BUY opportunities
RED: BEAR trend – signals downward momentum and potential SELL opportunities
DARK GRAY: FLAT trend – indicates weak momentum or a range-bound market
This simplicity allows traders to instantly identify trend direction, entry, and exit points.
Trade Signals and Usage
BUY Signals
Open a BUY position when the histogram turns BLUE, signaling the start of a bullish trend.
Place a stop loss below the previous swing low.
Consider exiting or monitoring positions when the histogram changes to DARK GRAY, indicating a weakening trend.
SELL Signals
Open a SELL position when the histogram turns RED, signaling the start of a bearish trend.
Place a stop loss above the previous swing high.
Exit trades when the histogram changes to DARK GRAY, indicating a FLAT market.
Aggressive Trading
Traders can ignore the FLAT trend and enter or exit directly when the histogram switches between BLUE and RED.
For better results, combine histogram signals with support and resistance zones, trendlines, or breakout strategies.
Best Practices
Apply the indicator on any timeframe; longer timeframes often reduce noise.
Combine the histogram with trendlines, channels, and breakout levels for higher accuracy.
Use non-redrawing signals for automated trading strategies.
Ideal for both trend-following and swing trading approaches.
By combining visual simplicity with reliable trend data, the CCI Histogram Volume Indicator increases trading efficiency and clarity.
Conclusion
The CCI Histogram Volume Indicator MT5 is a versatile tool for Forex traders looking to identify BULLISH, BEAR, and FLAT trends. Its color-coded histogram simplifies trend analysis and provides clear BUY and SELL signals. This indicator is suitable for traders of all experience levels and can be integrated with technical analysis tools or automated trading systems.
Download the CCI Histogram Volume Indicator for free at IndicatorForest.com and enhance your trend trading strategy today.
FAQ
4 Downloads
Published:
Dec 11, 2025 10:28 AM
Category: