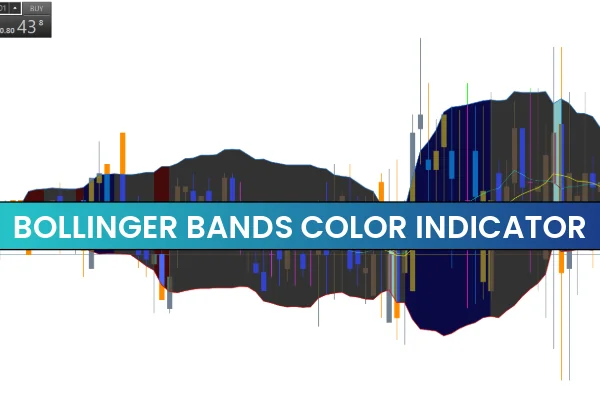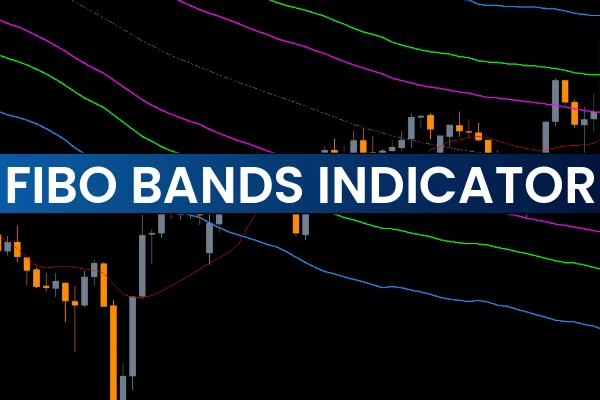
The True Bands Fibo Indicator for MT5 is an advanced version of the classic Bollinger Bands indicator that uses Fibonacci ratios instead of standard deviation to plot dynamic price bands. By incorporating the Fibonacci levels of 1.618, 2.618, and 4.236, the indicator automatically calculates upper and lower bands, helping traders identify potential market reversals and entry points.
This indicator is suitable for both new Forex traders and experienced professionals. Beginners should familiarize themselves with Bollinger Bands trading rules, while advanced traders can combine Fibo Bands with other indicators or automated trading strategies to enhance performance.
How the True Bands Fibo Indicator Works
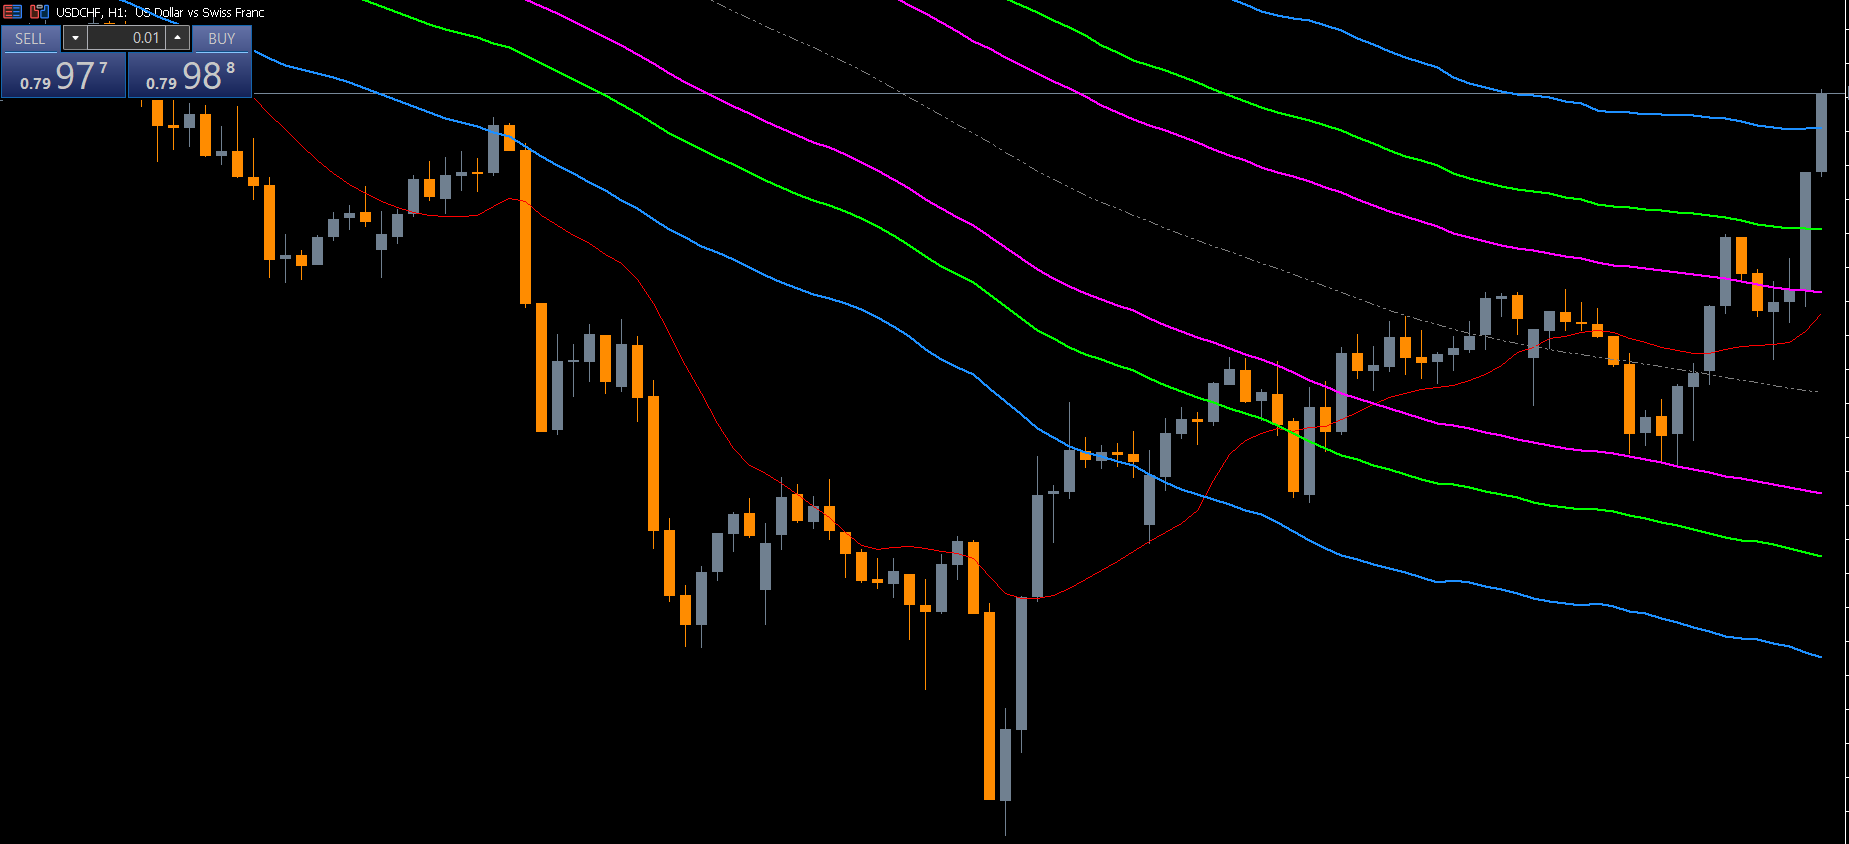
The indicator calculates three upper and three lower bands:
Outer light green bands: Correspond to the 4.236 Fibonacci level
Middle red bands: Correspond to the 2.618 Fibonacci level
Inner green bands: Correspond to the 1.618 Fibonacci level
The bands act as dynamic Support And Resistance levels, providing signals for market entries and exits.
Trading Rules
The indicator follows standard Bollinger Bands logic:
Overbought Condition: Price reaches the outer or middle upper band
Oversold Condition: Price reaches the outer or middle lower band
Traders can anticipate price reversals when the price interacts with these extreme bands. Confirmation requires that the price reverses and closes inside the inner band before entering a trade.
Fibo Bands Indicator Trading Signals
SELL Setup – Bearish Reversal
Price touches the outer or middle upper band
Price reverses and closes below the inner green band
Open a SELL / SHORT position
Place a stop loss above the previous swing high
Target the opposite band to lock in profits
BUY Setup – Bullish Reversal
Price touches the outer or middle lower band
Price reverses and closes above the inner green band
Open a BUY / LONG position
Place a stop loss below the previous swing low
Target the opposite band for profit
This method allows traders to trade reversals and continuations with clearly defined risk and reward levels.
Advantages of Using Fibo Bands for MT5
Enhanced accuracy: Fibonacci ratios are widely respected in technical analysis, giving more reliable bands.
Dynamic support and resistance: Bands adjust according to market volatility.
Compatibility with strategies: Works with Scalping, day trading, swing trading, and automated systems.
Versatile for any timeframe: Can be applied to M1, H1, or Daily charts.
By replacing standard deviation with Fibonacci levels, the True Bands Fibo Indicator provides a fresh perspective on market momentum and trend analysis.
Conclusion
The True Bands Fibo Indicator for MT5 is a modern twist on the classic Bollinger Bands indicator. By using Fibonacci ratios instead of standard deviation, it offers dynamic bands for detecting overbought and oversold zones. This allows traders to enter and exit trades with higher precision while managing risk effectively. You can download this powerful indicator for free at IndicatorForest.com and improve your Forex trading strategies today.
FAQ
5 Downloads
Published:
Nov 18, 2025 11:48 AM
Category: