Strategic Volatility Mapping with the Brooky Fibbed Donchian Indicator
In the complex environment of Forex and CFD trading, understanding the boundaries of price action is essential for identifying both Trend Continuation and reversal points. The Brooky Fibbed Donchian indicator for MetaTrader 4 (MT4) is a sophisticated architectural tool that enhances the classic Donchian Channel by integrating Fibonacci retracement logic. This fusion provides traders with a multi-layered map of market volatility, highlighting institutional "Value Zones" that standard indicators often miss.
The Evolution of the Donchian Channel
While a traditional Donchian Channel simply tracks the highest high and lowest low of a specific period, the Brooky Fibbed Donchian applies a mathematical "skeleton" to that range. It divides the current price channel into specific Fibonacci ratios, creating a series of dynamic support and resistance bands that expand and contract in real-time.
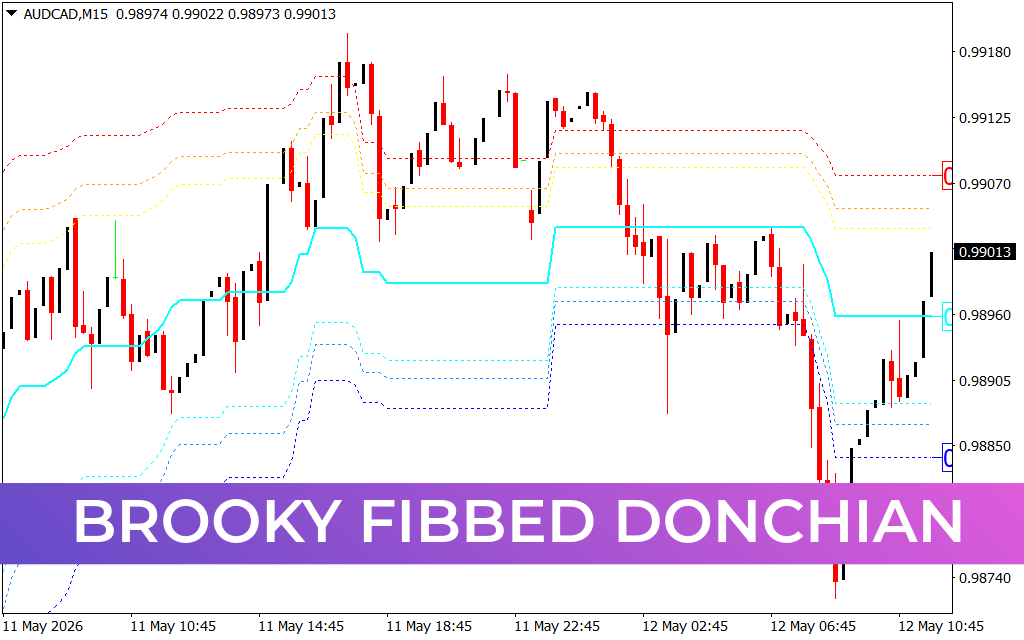
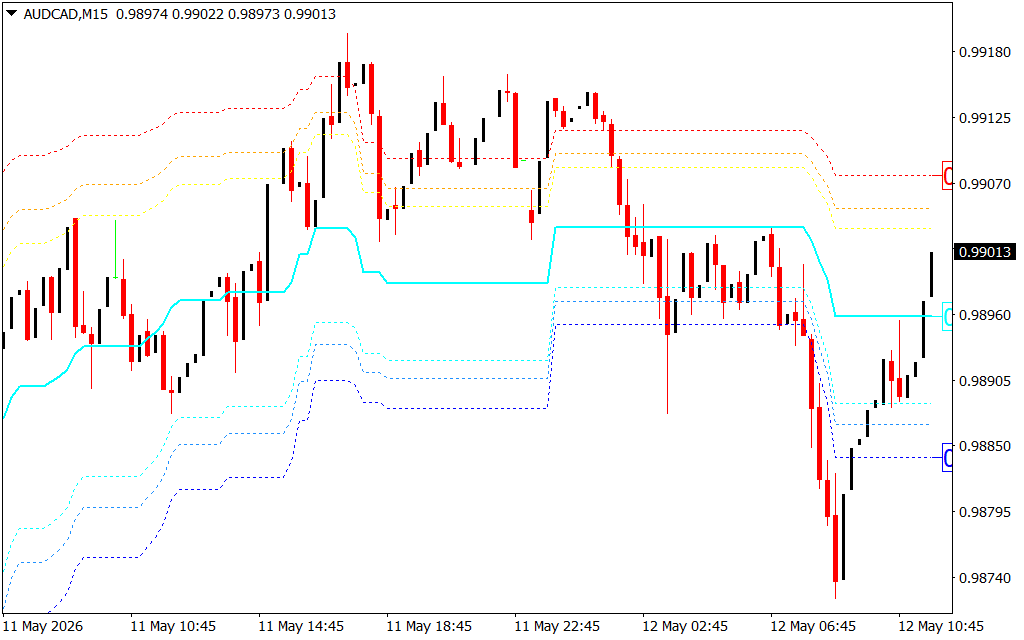
As illustrated in the AUD/CAD M15 chart, the indicator projects a series of stepped, color-coded bands:
- The Outer Boundaries (Red and Blue): These dashed lines represent the absolute extremes of the market's recent range. Price interacting with these levels often signals extreme overbought or oversold conditions.
- The Median "C" Level (Cyan): This solid central line acts as the market's equilibrium point. In a trending market, price will often use this level as a "launchpad" for the next move.
- The Fibonacci Inner Bands (Yellow and Light Blue): These dashed internal lines represent the 38.2%, 50%, and 61.8% retracement levels of the current Donchian range. These are the primary zones where institutional "buy the dip" or "sell the rip" orders are typically located.
Strategic Advantages for Professional Traders
The Brooky Fibbed Donchian is a versatile utility that serves multiple roles in a technical strategy:
- Objective Volatility Assessment: The width of the bands provides an immediate visual representation of market volatility. Wide bands suggest high-impact news or strong trending, while narrow bands indicate low-volatility consolidation.
- Dynamic Support and Resistance: Unlike static horizontal lines, these levels move with Price Action. This allows traders to identify "hidden" support and resistance levels that shift as the market creates new highs or lows.
- Precise Exit and Target Scaling: The Fibonacci bands provide natural targets for scaling out of positions. A trader might take partial profits at the Median "C" level and hold the remainder for a move to the outer Donchian boundary.
- Trend Confirmation: The "stepping" nature of the lines helps identify clear trend direction. If the steps are moving higher, the bias is bullish; if they are cascading downward, the bias is bearish.
Execution and Confluence
The Brooky Fibbed Donchian excels when used to identify "Mean Reversion" trades. In the provided AUD/CAD example, the indicator successfully tracks a deep correction, showing price finding temporary stability at the lower Fibonacci boundaries before attempting a recovery. When price touches an outer band while a secondary oscillator (like the CCI Filter) shows exhaustion, the probability of a high-reward reversal trade increases significantly.
By integrating the Brooky Fibbed Donchian into your MetaTrader setup, you gain a professional structural guide that clarifies price action. It transforms a simple price range into a detailed roadmap of institutional interest, allowing you to trade with the precision required for long-term profitability.
1 Download
Last Update:
May 12, 2026 14:55 PM
Published:
Jan 23, 2026 13:31 PM
Category: