The Butterfly Pattern Indicator is a powerful and free tool for MetaTrader 4 (MT4) that helps traders identify potential market reversal points. By detecting specific chart patterns, this indicator enables traders to enter and exit trades at optimal price levels, providing a strategic edge in Forex trading.
Understanding the Butterfly Pattern Indicator
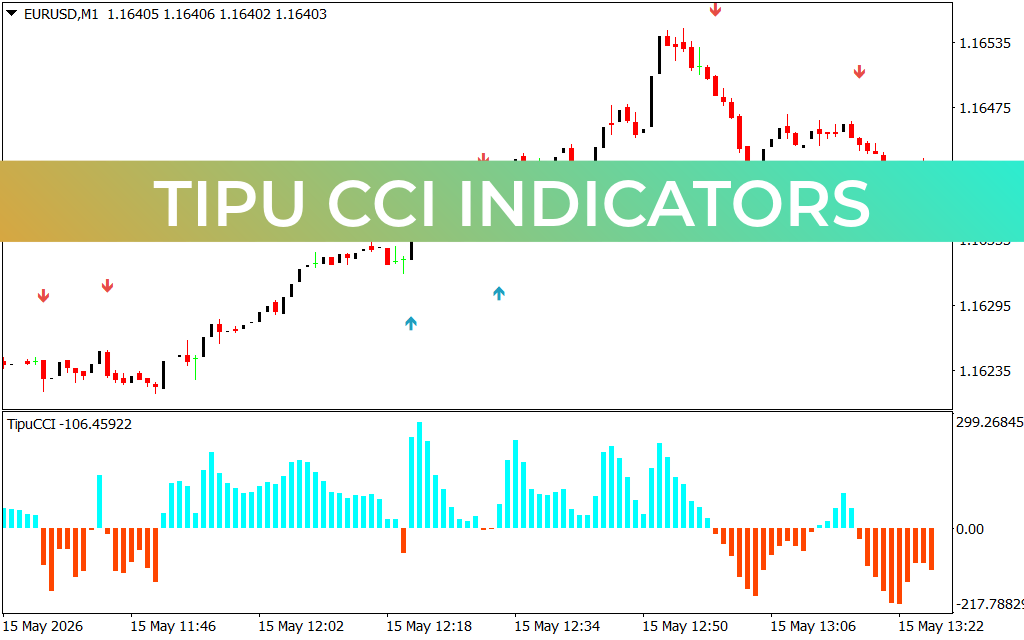
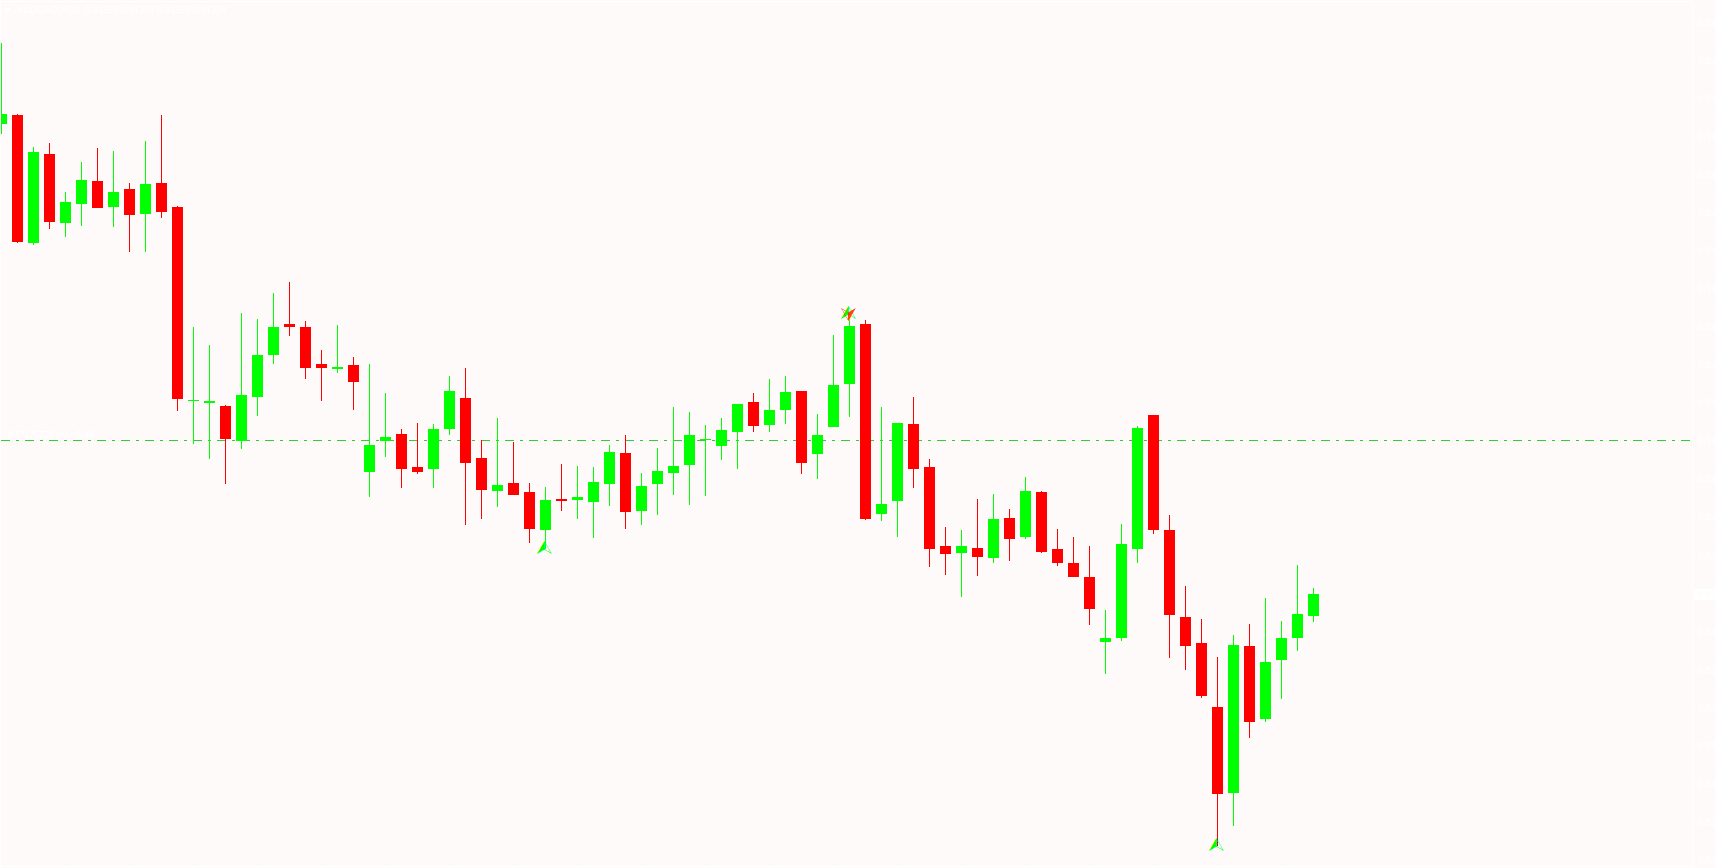
This indicator identifies a specific chart pattern composed of three points, signaling potential market reversals. It then provides clear entry and exit signals using visual arrows: green arrows at the bottom indicate buy opportunities, while a combination of green and red arrows at the top signals potential sell opportunities. This visual clarity allows traders to act promptly on pivotal market movements.
Key Features of the Butterfly Pattern Indicator
Pattern Recognition: Detects the Butterfly pattern, signaling possible reversals.
Clear Trading Signals: Uses colored arrows for easy identification of buy and sell opportunities.
Market Timing: Helps traders enter trades at advantageous price levels.
User-Friendly: Suitable for both beginner and experienced Forex traders.
Benefits of Using the Butterfly Pattern Indicator
Enhanced Trade Decisions: Identifies potential reversal points for better entry and exit timing.
Visual Clarity: Colored arrows make signals easy to understand and act upon.
Versatile Application: Useful for Scalping, intraday, and swing trading strategies.
Increased Confidence: Provides objective signals to reduce emotional trading mistakes.
How to Use the Butterfly Pattern Indicator Effectively
Combine the Butterfly Pattern Indicator with other technical tools, such as support/resistance levels, moving averages, or oscillators, to confirm potential reversals. Monitor the appearance of arrows for timely trade entries and exits, and use risk management strategies to optimize results.
Download the Butterfly Pattern Indicator from IndicatorForest.com to enhance your Forex trading strategy and capitalize on key reversal opportunities in the market.
FAQ
The Butterfly Pattern Indicator identifies a specific chart pattern composed of three points that signals potential market reversals. It provides clear entry and exit signals using visual arrows: green arrows at the bottom indicate buy opportunities, while a combination of green and red arrows at the top signals potential sell opportunities.
Enter buy trades when green arrows appear at the bottom of the pattern, indicating a potential bullish reversal. Enter sell trades when green and red arrows appear at the top, signaling a potential bearish reversal. The visual clarity of the arrows allows traders to act promptly on pivotal market movements.
The indicator helps identify potential reversal points for better entry and exit timing by detecting a specific three-point pattern that historically signals market reversals. This pattern recognition helps traders enter trades at advantageous price levels before reversals become obvious to other traders.
Combine the Butterfly Pattern Indicator with other technical tools such as support/resistance levels, moving averages, or oscillators to confirm potential reversals. Monitor the appearance of arrows for timely trade entries and exits, and use risk management strategies to optimize results.
Yes, the indicator is useful for scalping, intraday, and swing trading strategies. The visual clarity of colored arrows makes signals easy to understand and act upon, providing objective signals to reduce emotional trading mistakes and increase trading confidence.
Published:
Dec 15, 2025 23:57 PM
Category: