Mastering Price Momentum: The Ultimate Guide to the Candle Strength Indicator
In technical trading, a candle's closing price tells only half the story. A large bullish green candle looks strong on a chart, but without analyzing the underlying force of that specific move, you risk buying right into institutional distribution. Traditional oscillators attempt to solve this by smoothing out price changes over several periods, but they inherently add lag to your charts. To survive high-velocity market environments, traders need a real-time tool that measures individual candlestick velocity. The Candle Strength indicator provides this exact edge, transforming raw price delivery into an objective index of buyer and seller dominance.
By evaluating the precise body-to-wick ratio and closing location of every single candlestick, this powerful utility filters out market noise and unmasks true market conviction.
Decoding the Candle Strength Histogram
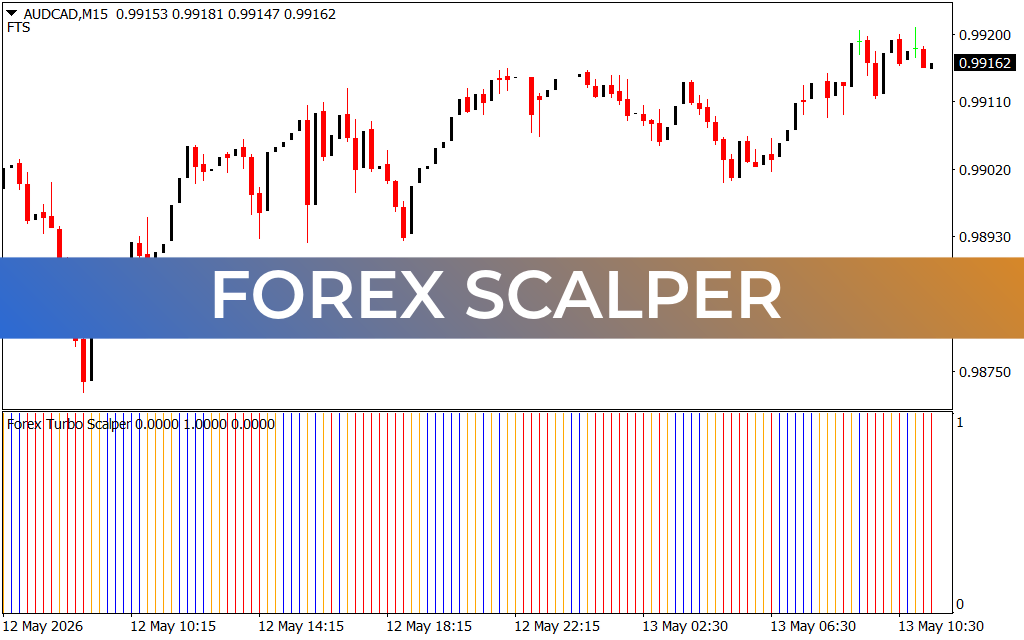
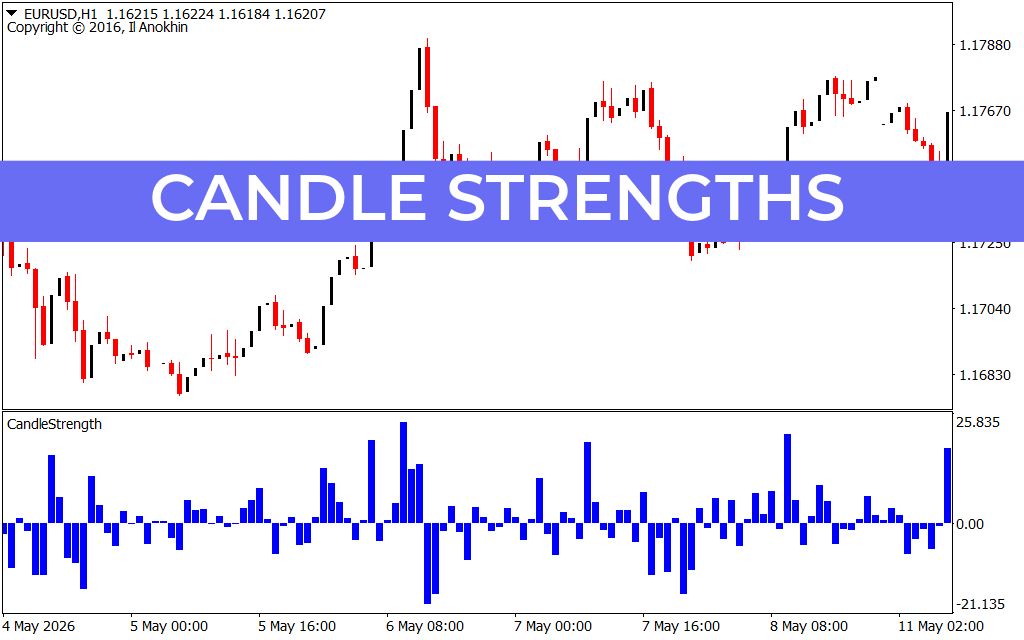
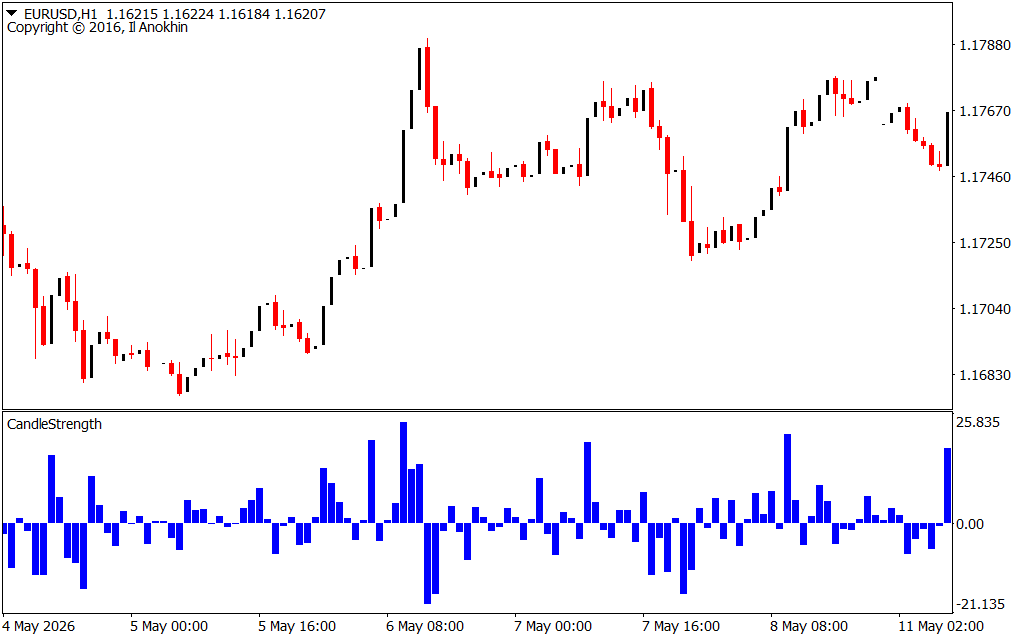
Operating seamlessly inside a dedicated sub-window below your main price screen, the indicator translates candlestick dynamics into an intuitive, zero-centered blue histogram:
- Aggressive Bullish Conviction: When institutional buyers flood the market with buy orders, the histogram prints surging blue bars above the 0.00 baseline. A spike in these positive bars confirms that a bullish candle closed near its absolute high with real momentum, providing a green light to hunt for trend-continuation setups.
- Dominant Bearish Expansion: Conversely, when sellers overwhelm the order book, the blue bars expand aggressively downward below the zero line. As observed during sharp market drop-offs, these deep negative bars indicate heavy institutional liquidations, warning retail traders to avoid buying the dip prematurely.
- The Equilibrium Squeeze: When the blue histogram bars contract tightly around the central 0.00 line, it highlights a low-liquidity squeeze or an indecisive doji range. This visual layout tells you that neither side has established structural control, signalling the perfect time to sit on your hands.
Tailored for High-Frequency Execution
The Candle Strength indicator is an invaluable tool for short-term trading styles like 5-minute Scalping or sixty-second micro-trades on lower timeframes like the 1-minute (M1) chart. On these fast-paced screens, fake breakouts occur constantly. By filtering your entries through this indicator, you gain an immediate mathematical filter.
Instead of chasing a breakout candle blindly, you look down at the histogram. If the price breaks a key structural level and is accompanied by a massive expansion in the Candle Strength bar, you have instant validation that big money is driving the move. Conversely, if a candle attempts to break out but the histogram remains flat, you are likely looking at a trap. By pairing this real-time momentum engine with your standard Price Action setups, you turn your MetaTrader terminal into a precision-focused trading workspace.
3 Downloads
Last Update:
May 17, 2026 16:18 PM
Published:
Jan 20, 2026 21:10 PM
Category: