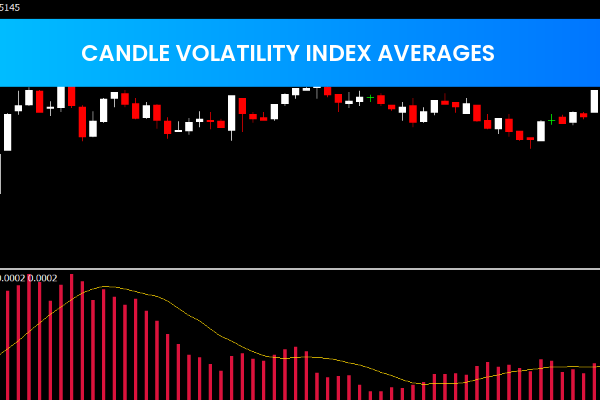
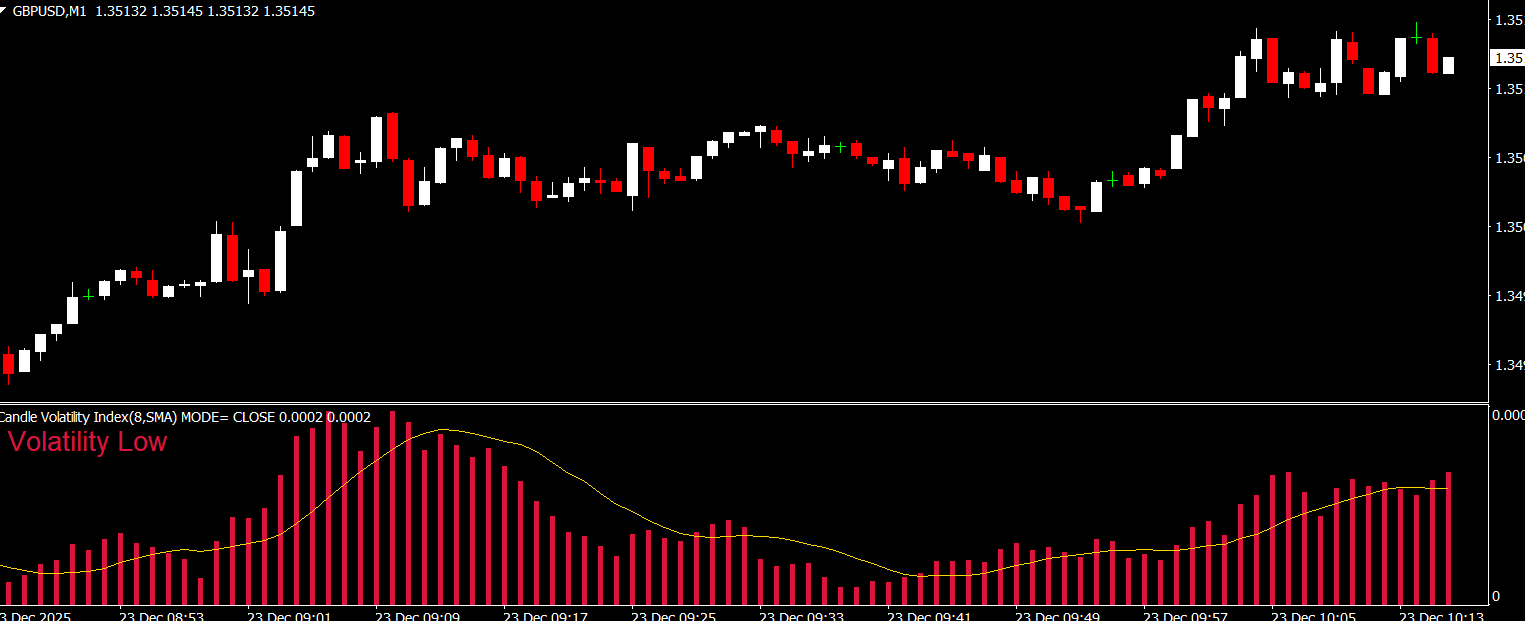
The Candle Volatility Index Averages (CVI) Indicator is a free and popular MT4 Forex tool that helps traders measure market volatility and identify potential trading opportunities. By displaying two lines based on the Average True Range (ATR), this indicator provides clear insights into market trends and potential entry and exit points.
How the Candle Volatility Index Averages Works
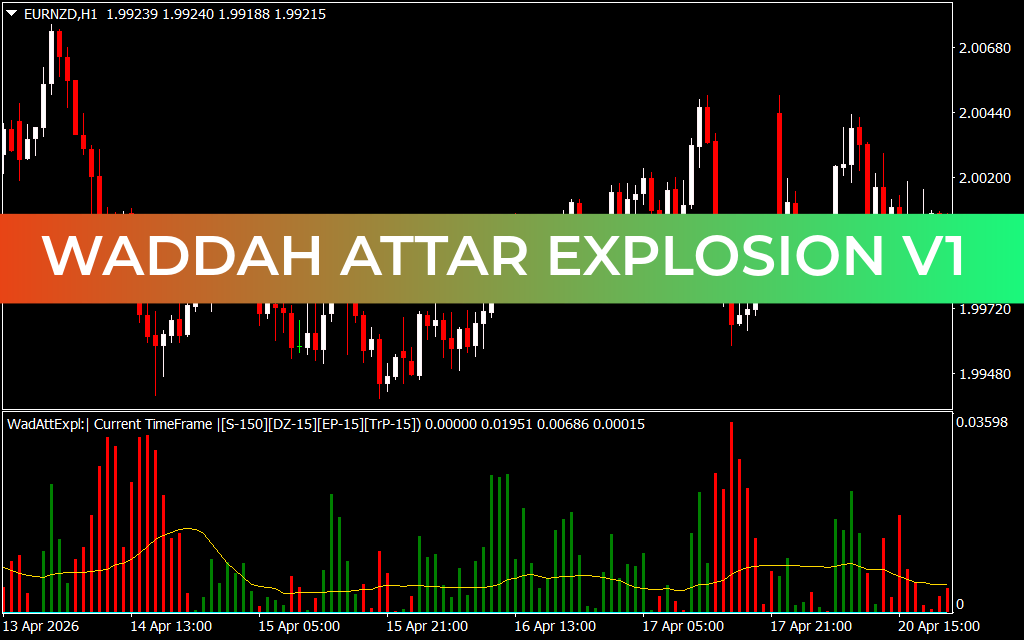
The CVI indicator uses the Average True Range (ATR) to analyze market volatility:
ATR Line: Shows the true range of price movements over a period of time.
ATR Average Line: Displays the average of the ATR over the same period, smoothing out short-term fluctuations.
By comparing these two lines, traders can gauge market volatility, identify trends, and spot potential reversals or continuation points.
Key Features of the Candle Volatility Index Averages
Measures market volatility using ATR
Identifies potential entry and exit points
Shows trend direction and strength
Helps detect overbought and oversold conditions
Can indicate potential Support And Resistance levels
Free and compatible with MT4
Using CVI for Forex Trading
Identifying Market Trends
When the ATR line is above its average, it often indicates increasing volatility, which can signal strong trending conditions. Conversely, when the ATR line is below its average, volatility is decreasing, suggesting potential consolidation or weaker trends.
Entry and Exit Points
Traders can use the CVI indicator to time entries and exits:
Enter trades when volatility is increasing and aligns with the trend.
Exit trades when volatility decreases or reaches extremes, indicating potential reversals.
Support and Resistance Levels
The CVI indicator can also help identify key levels in the market. High ATR values often coincide with breakouts, while low ATR values suggest consolidation near support or resistance.
Benefits of Using Candle Volatility Index Averages
Provides a clear visual representation of volatility and Trend Strength
Helps traders make informed decisions for entries and exits
Works on any timeframe and currency pair signal
Enhances risk management by identifying potential market extremes
Free to download and use on MT4
Final Thoughts
The Candle Volatility Index Averages (CVI) Indicator is a powerful MT4 tool for traders looking to understand market volatility and identify high-probability trading opportunities. By combining ATR with its moving average, it provides both trend insights and volatility analysis, making it a valuable addition to any trading strategy.
👉 Visit IndicatorForest.com to download the Candle Volatility Index Averages Indicator and explore more free MT4 tools to improve your Forex trading.
FAQ
Published:
Dec 23, 2025 04:18 AM
Category: