Unlocking Institutional Order Flow: Trading Volatility with the Volumes Trading Indicator
In the financial markets, price movement tells you where the market is going, but volume tells you how much force is behind the move. Standard candlestick charts show Price Action in a vacuum, leaving retail traders blind to the true intentions of institutional players. The Volumes Trading Indicator bridges this gap by bringing professional-grade tick volume analysis directly to your sub-window, helping day traders and scalpers confirm Trend Strength and spot impending reversals with absolute precision.
Decoding Volume Dynamics on the EUR/USD M30 Chart
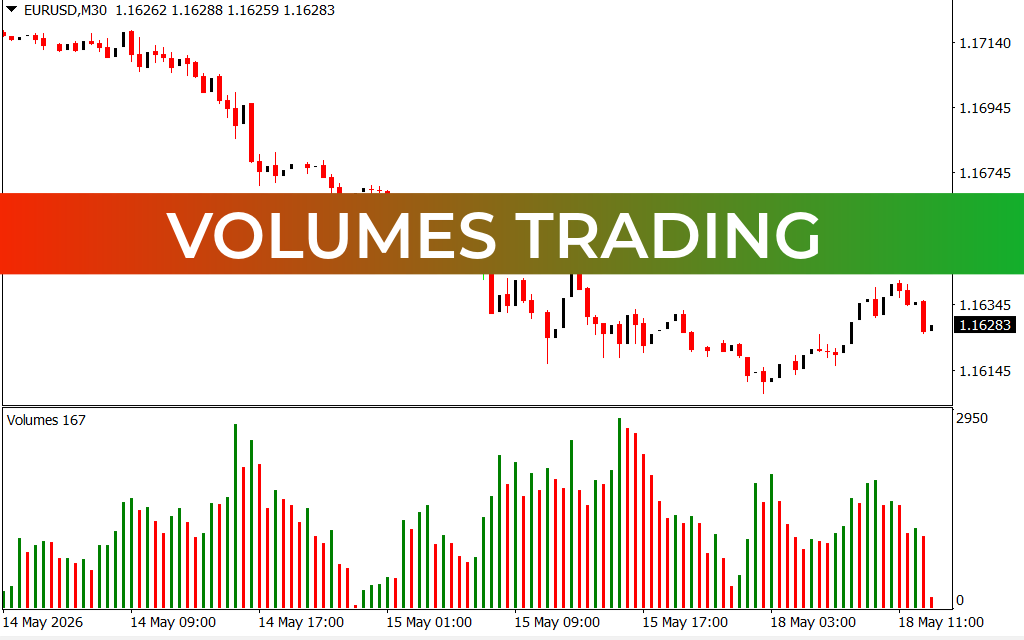
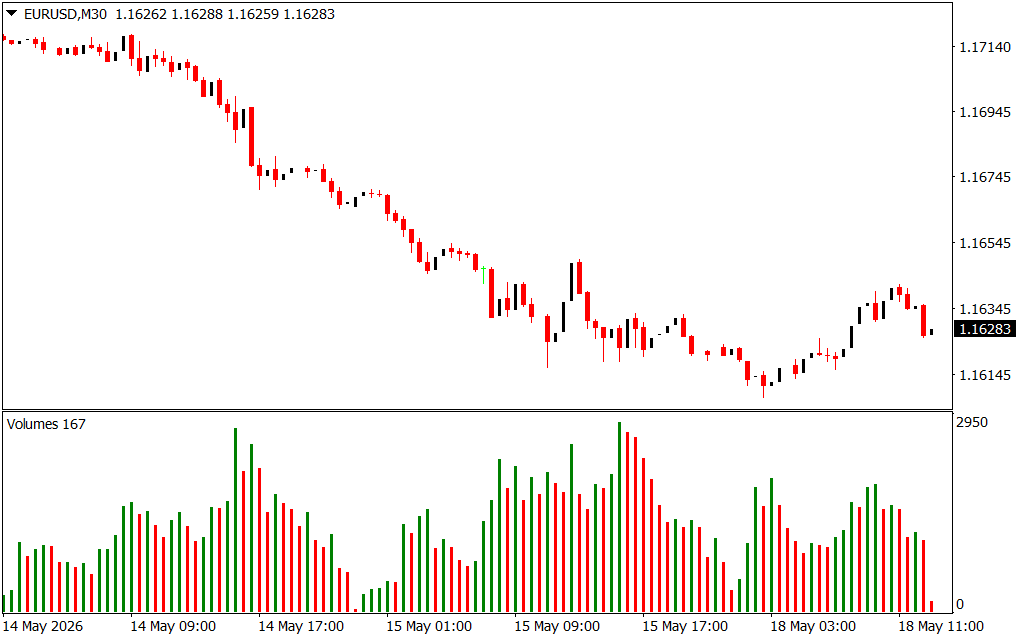
The attached EUR/USD 30-minute (M30) chart demonstrates the power of pairing structural price action with volume bars over a multi-day trading session.
During the initial markdown phase on May 14, the price plummeted from the 1.17140 region. Looking at the Volumes Trading Indicator below, notice the significant surge in vertical volume bars during this decline. High volume accompanying a sharp drop in price confirms a healthy, strong bearish trend fueled by institutional distribution. This tells traders that the selling pressure is genuine and that attempting to buy the dip early would be fighting a massive wall of market momentum.
As the trend progressed into May 15, we witness a classic volume divergence. While the price continued to print lower lows, the localized spikes in volume began to shift behavior. Notice the massive green volume bars pushing high spikes mid-day on May 15. This indicates climactic volume—a sudden rush of buying interest where institutional algorithms step in to absorb the remaining retail sell orders.
Confirming Reversals and Scalping Setups
The true value of the Volumes Trading Indicator shines during structural transitions. Following the final bearish exhaustion low near 1.16145, the Market Structure began to shift on May 18, putting in a steady sequence of higher lows.
Looking closely at the price action on May 18, the initial bullish push out of the bottom was backed by elevated, stable volume bars. This confirms that the upward move is not a temporary "dead cat bounce" or a low-liquidity stop-run, but a structural accumulation phase. Currently, the price sits at 1.16283. For day traders using volume analysis, this layout provides a safe entry framework: entering a long position as the price holds its ground on steady, supportive volume, while placing risk invalidation levels right below the high-volume exhaustion floor.
By integrating the Volumes Trading Indicator into your MT4 or MT5 workspace, you stop trading blindly based on patterns alone. Instead, you trade with the confidence of knowing exactly when big money enters the market, allowing you to ride institutio
3 Downloads
Last Update:
May 18, 2026 16:04 PM
Published:
Jan 20, 2026 14:58 PM
Category: