Enhance Your Visual Precision: The Candles Indicator for MT4/MT5
In the world of technical analysis, the most fundamental piece of data is the candlestick. However, standard platform settings often lack the visual clarity needed for rapid decision-making, especially during high-volatility sessions. The Candles Indicator is a specialized utility designed to overhaul how Price Action is displayed, ensuring that every wick and body tells a clear story of market sentiment.
Why Visual Clarity Matters in Trading
Trading is as much about psychology and pattern recognition as it is about numbers. Standard candlesticks can sometimes blend together, making it difficult to identify key structures like engulfing patterns, hammers, or dojis at a glance. The Candles Indicator solves this by providing enhanced color-coding and border definitions that make price action "pop" against your chart background.
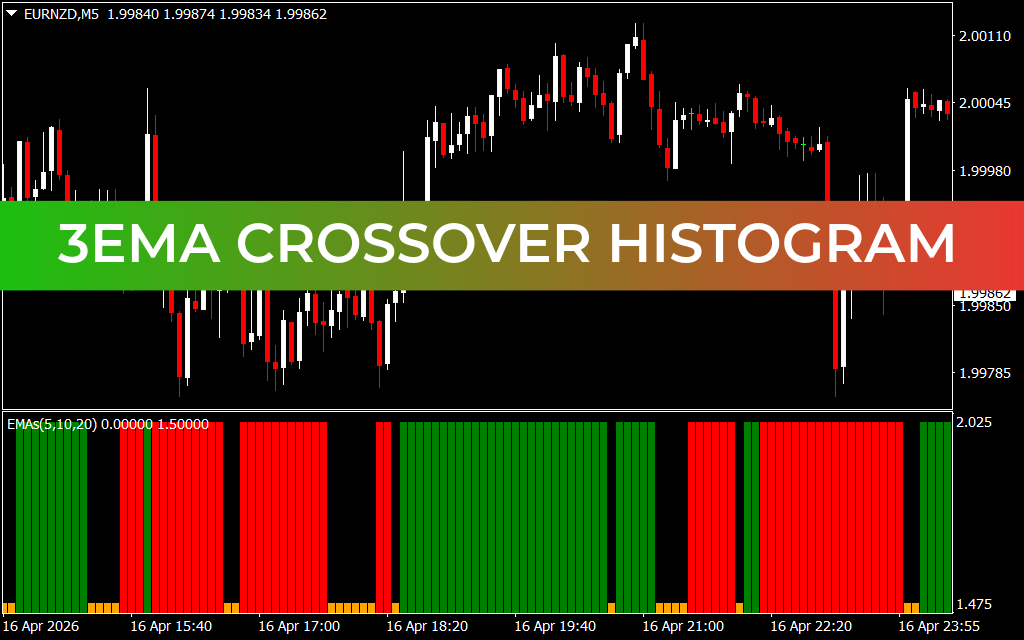
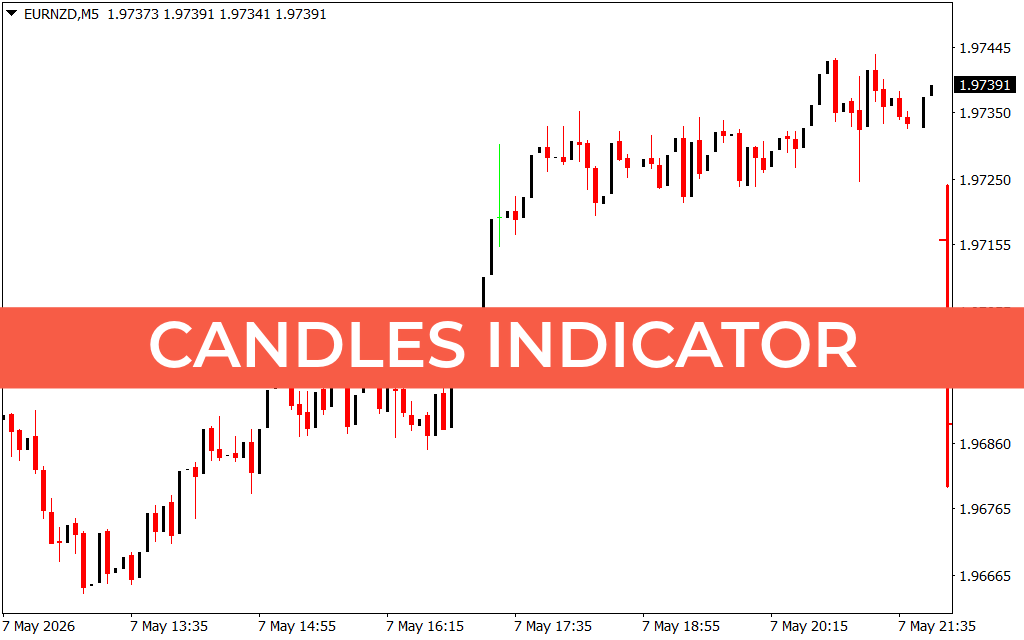
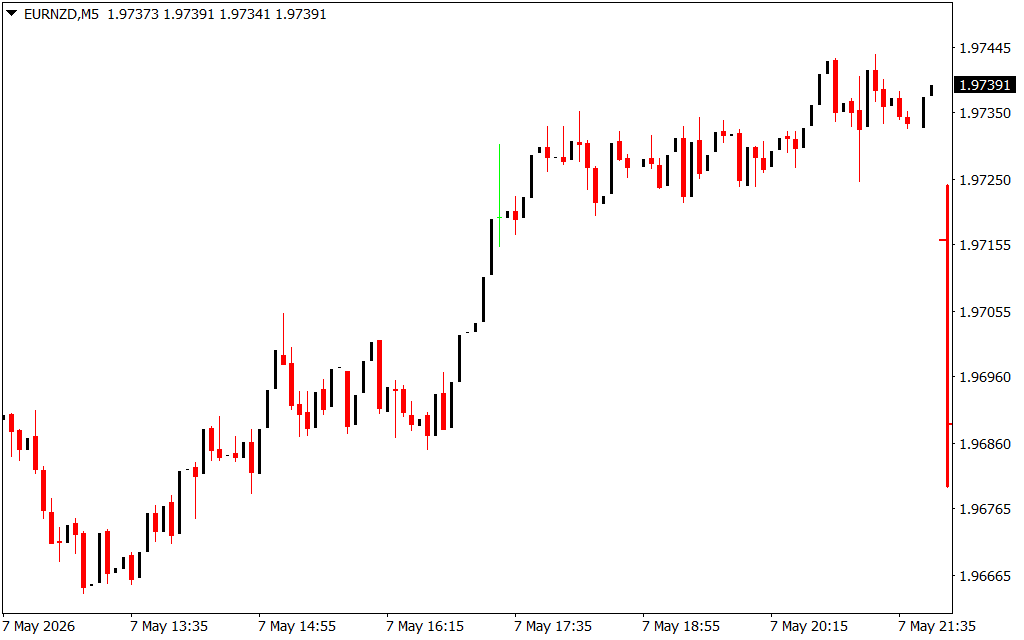
As seen in the EURNZD M5 chart, clear candle definition is vital for short-term Scalping. When the market moves quickly—such as the sharp bullish expansion shown—having an indicator that highlights the strength of each candle helps a trader stay calm and follow the momentum rather than exiting prematurely.
Key Features of the Candles Indicator
- Customizable Aesthetics: Tailor the thickness, color, and style of your candles to match your specific trading environment, whether you prefer a dark mode or a high-contrast light background.
- Highlighting Momentum: Many versions of this indicator include logic to color-code candles based on their relative size or volume, instantly signaling an "impulse" move versus a "corrective" move.
- Improved Wick Visibility: By emphasizing the wicks (shadows) of the candles, the indicator makes it easier to spot rejection zones and liquidity sweeps—essential for traders focusing on Support And Resistance.
- Platform Optimization: Designed for both MT4 and MT5, the indicator is lightweight and won't cause lag, even when running on multiple currency pairs simultaneously.
Integrating with Price Action Strategies
The Candles Indicator is the perfect companion for Price Action purists. Without the clutter of lagging oscillators, this tool allows you to focus on what matters most: the price. For instance, when looking at the M5 timeframe, a trader can easily spot the "stair-stepping" higher lows that lead to a breakout.
By using the Candles Indicator, patterns like the "Three White Soldiers" or "Inside Bars" become much more obvious. This reduction in cognitive load allows you to spend less time squinting at the screen and more time identifying high-probability entry and exit points.
Conclusion
The Candles Indicator is a foundational tool for any trader who values clarity and precision. By transforming raw data into a clean, highly readable visual format, it empowers you to interpret market psychology in real-time. Whether you are a beginner learning the basics of candle formations or a professional refining a complex scalping system, this indicator provides the visual edge necessary for consistent performance.
2 Downloads
Last Update:
May 08, 2026 00:59 AM
Published:
Jan 26, 2026 18:21 PM
Category: